XTended Oracle SQL

More tricks with OPT_PARAM
Did you know you can set most parameters for the execution of a single statement without using an Alter Session by using an OPT_PARAM hint? For example, regular parameters (here forcing the storage clause in the query plan):
SQL> select /*+ OPT_PARAM('cell_offload_plan_display' 'always') */ col1 From table1;
and underscore parameters:
SQL> select /*+ OPT_PARAM('_arch_comp_dbg_scan',2048) */ n_name from nation;
However if you try conflicting settings that set a different value in an inner query block, the value you set in the outermost query block will prevail. In this trvial example _arch_comp_dbg_scan=2048 will prevail:
SQL> select /*+ OPT_PARAM('_arch_comp_dbg_scan',2048) */ n_name from nation
where n_nationkey = (
    select /*+ OPT_PARAM('_arch_comp_dbg_scan',0) */ min(r_regionkey)
    from region where n_name < r_name);
Another point to remember is that not all parameters get their value from the cursor environment. For example the buffer cache gets the raw value of _serial_direct_read so it cannot be overruled in this way:
SQL> select /*+ OPT_PARAM('_serial_direct_read', always) */ n_name from nation;
will not force a DR scan of the table but an alter session will.
Just one more tool to keep in your toolkit for when you need it.
—
Roger
Improvements to HCC with wide tables in 12.2
Since the beginning Oracle has provided four compression levels to offer a trade-off between the compression ratio and various other factors including table scans and the performance of single-row retrieval. I can not emphasize enough that the various trade offs mean that YMMV with the different levels and you should always test what works best with your application and hardware when choosing the level. Historically people have rarely used Query Low since the fast compression with reduced compression ratio means that the extra disk I/O is slower than the cost of decompression with Query High. The one time that Query Low makes sense on spinning disks is if you still have a significant number of row retrieval operations (including from index access joins).
NMVe FlashX5 introduced NVMe technology which means that the extra I/O from Query Low is faster than ZLIB decompression which makes Query Low beneficial. So we needed to reassess the sizing of Compression Units. from 11.2.0.1 to 12.1.2.4 the sizing guidelines are as follows:
Name TargetRows Target
Minimum Size Target
Maximum Size CompressionQuery Low 1000 to 8000 32 kb 32 kb LZOQuery High 1000 to 8000 32 kb 64 kb ZLIBArchive Low 8000 64 kb 256 kb ZLIBArchive High 8000 256 kb 256 kb BZ2
So, for example, Compress for Query High aims to pivot around at least 1000 rows and create a minimum compression unit size of 32 kb and a maximum of 64 kb. Using 12.1.2.3 I ran these against a TPC-H Lineitem table than contained between 1 and 6 copies of each column.
For Query Low fixed 32 kb CUs this gave us the following:
Additional copies of lineitem Rows per 32 kb CU 0 2797 1 580 2 318 3 216 4 162 5 129and for Query High 32 to 64 kb CUs this gave us:
Additional copies of lineitem Rows per 32 kb CU CU ave size 0 5031 32 1 1010 32 2 936 51 3 794 63 4 595 67 5 476 63so we see that the CU size remains as 32 kb as long as we are getting a 1000 rows or more then increases in size to 64 kb to try and fit in at least 1000 rows.
It became clear that this size range was inadequate for wide tables so to get more efficient compression and longer column runs for faster predicate performance (and also better CELLMEMORY rewrites) we removed the fixed size for Query Low and increased the max:
Query Low: 32 kb to 64 kb
Query High: 32 kb to 80 kb
This will not affect narrow tables at all but wider tables should see better table compression and faster scans at the cost of slightly slower single row retrieval for data loaded by 12.2 RDBMS. If you have HCC wide tables and typically cache them on flash cache you should consider re-evaluating Query Low for data loaded in 12.2 (or use Alter Table Move Compress to recompress existing data).
Roger
How to tell if the Exadata column cache is fully loaded
When a background activity is happening on the cell you typically can’t use RDBMS v$ views to monitor it in the same way. One such question is how to tell if a segment is fully loaded in the Exadata column cache since this does not appear in the equivalent In-Memory v$ views.
When a segment is scanned by Smart Scan sufficiently often to be eligible the AUTOKEEP pool (typically that means at least twice an hour), the eligible 1MB chunks are written to flash in 12.1.0.2 style format, and put on a background queue. Lower priority tasks pick up the queued 1MB 12.1.0.2 format chunks from the flash cache, run them though the In-Memory loader, and rewrite the pure columnar representation in place of the old 12.1.0.2 style column cache chunks.
The easiest way that I know of to tell when this completes is to monitor that background activity is to use the following query until it shows zero:
select name, sum(value) value from (
      select extractvalue(value(t),'/stat/@name') name,
            extractvalue(value(t),'/stat') value
      from v$cell_state cs,
           table(xmlsequence(extract(xmltype(cs.statistics_value),
                                     '//stats[@type="columnarcache"]/stat'))) t
     where statistics_type='CELL')
     where name in ('outstanding_imcpop_requests')
     group by name;
External Tables Part 1 – Project Columns All vs Referenced
I normally blog about table scans on Oracle native data but Oracle also supports a wide variety of features for scanning external tables and I need to cover these too. One of the ways I learn new things is being sent a bug report and saying to myself “Oh! I didn’t know you could do that”. So today I’m going to start with the grammar:
Alter Table <xt> Project Columns [ All | Referenced ]
This DDL changes the value in the Property column displayed in user_external_tables:
SQL> select property
2    from user_external_tables
3    where table_name='C_ET';

PROPERTY
----------
ALL
Here we have an external table defined using the legacy driver ORACLE_LOADER. This driver defaults to projecting all the columns in the base table rather than just those needed to satisfy the query (i.e. the referenced columns) and discarding rows that have data conversion issues up to the reject limit.
So for example we have a DATE column in our external table that contains dirty data that won’t convert cleanly to Oracle internal dates using the supplied mask we can either import it as a VARCHAR2 to not lose values or import it as a date but lose rows even on queries that don’t need that date column. We can change the behaviour to only project the referenced columns by
SQL> alter table c_et project column referenced;

Table altered.

SQL>
SQL> select property
2    from user_external_tables
3    where table_name='C_ET';

PROPERTY
----------
REFERENCED
The driver will now ignore unreferenced columns and if the date column is not used we will get all the rows in the external data and the query will run faster since datatype conversion is expensive but we may get an inconsistent number of rows depending on which columns are used in any given query. This is OK if the DBA knows a priori that there are no conversion errors or if they are willing to live with inconsistency in the number of rows returned.
The big data drivers such as ORACLE_HIVE have a different default behaviour which is to only project referenced columns and to replace data with conversion errors with NULL values and i.e. they default to returning a consistent number of rows with best performance.
Take away: In order to get consistency and fast table scan performance with ORACLE_LOADER, the trick is to define the external table with the ‘convert_error store_null’ option and switch to ‘Project Column Referenced’. For example:
CREATE TABLE "T_XT"
(
  c0 varchar(10),
  c1 varchar(10)
)
ORGANIZATION external
(
  TYPE oracle_loader
  DEFAULT DIRECTORY DMPDIR
  ACCESS PARAMETERS
  (
    RECORDS DELIMITED BY NEWLINE
    CHARACTERSET  al32utf8
    ESCAPE
    FIELDS CSV WITH EMBEDDED terminated by ',' enclosed by '|'
    REJECT ROWS WITH ALL NULL FIELDS
    nullif equal blanks
    truncate_columns
    convert_error store_null
    (
      "C0" CHAR(10),
      "C1" CHAR(10)
    )
  )
  location
  (
    'simple.dat'
  )
) REJECT LIMIT UNLIMITED
parallel 4;
If you want more information on handling conversion errors when scanning an external table please check the Utilities Guide section on each driver type
Examining the new Columnar Cache with v$cell_state
12.1.0.2 introduced the new Columnar Flash Cache where 1MB of blocks that are all in HCC format are rewritten so as to make each column from each CU contiguous. This works by first writing all the block headers to an array, then writing all the CU headers to an array, finally writing all the Column 1 column-level-CUs, then writing all the Column2 column-level-CUs etc.
The flash cache hash table maintains a simple mapping of column numbers to 64KB flash pages so, for any given query, we can simply do asynchronous disk I/O of the minimum set of 64KB pages required to cover the referenced columns.
Within the “flashcache” cell stats there is a new nested cell stat called “columnarcache” that enables you to track how it is working.
> set long 50000000
> set pagesize 10000
> select xmltype(STATISTICS_VALUE).getclobval(2,2) from v$cell_state;

XMLTYPE(STATISTICS_VALUE).GETCLOBVAL(2,2)
--------------------------------------------------------------------------------
....

  <stats type="flashcache">
    <stats type="columnarcache">
      <stat name="columnar_cache_size">0</stat>
      <stat name="columnar_cache_keep_size">0</stat>
      <stat name="columnar_cache_keep_read">0</stat>
      <stat name="columnar_cache_keep_read_bytes">0</stat>
      <stat name="columnar_attempted_read">0</stat>
      <stat name="columnar_attempted_read_bytes">0</stat>
      <stat name="columnar_cache_hits">0</stat>
      <stat name="columnar_cache_hits_read_bytes">0</stat>
      <stat name="columnar_cache_hits_saved_bytes">0</stat>
      <stat name="columnar_cache_pop">0</stat>
      <stat name="columnar_cache_pop_bytes">0</stat>
      <stat name="columnar_cache_pop_throttled">0</stat>
      <stat name="columnar_cache_pop_invalid_buf">0</stat>
      <stat name="columnar_cache_pop_size_align">0</stat>
      <stat name="columnar_cache_pop_findchdrfailure_mainchdr">0</stat>
      <stat name="columnar_cache_pop_findchdrfailure_childchdr">0</stat>
    </stats>
  </stats>
I typically spool the output of this to wade through it an editor but if we want to monitor how it is working with some workload, we need to extract individual stats, for example I bounced the cells and verified the cache was empty:
> select xmlcast(xmlquery('/cell_stats/stats/stats/stat[@name="columnar_cache_size"]' passing xmltype(STATISTICS_VALUE) returning content) as varchar2(200) ) "COLUMNAR CACHE SIZE"
from v$cell_state
where xmlexists('/cell_stats/stats/stats[@type="columnarcache"]' passing xmltype(STATISTICS_VALUE));

COLUMNAR CACHE SIZE
--------------------------------------------------------------------------------
0
I am using the 1GB TPC-H schema which takes a little more 400MB on disk when compressed with Query Low:
SQL> select sum(bytes) from user_segments where SEGMENT_NAME in ('SUPPLIER','PARTSUPP','LINEITEM','ORDERS','PART','CUSTOMER');

SUM(BYTES)
----------
 420675584
and checking the columnar cache again shows about half of the data has been rewritten into columnar cache format instead of caching raw blocks:
SQL> select xmlcast(xmlquery('/cell_stats/stats/stats/stat[@name="columnar_cache_size"]' passing xmltype(STATISTICS_VALUE) returning content) as varchar2(200) ) "COLUMNAR CACHE SIZE"
from v$cell_state
where xmlexists('/cell_stats/stats/stats[@type="columnarcache"]' passing xmltype(STATISTICS_VALUE));

COLUMNAR CACHE SIZE
--------------------------------------------------------------------------------
179306496
So let’s look at how the cache helped:
select
   xmlcast(
      xmlquery(
         '/cell_stats/stats/stats/stat[@name="columnar_cache_hits_read_bytes"]'
         passing xmltype(STATISTICS_VALUE)
         returning content
      ) as varchar2(200)
   ) "HIT READ BYTES"
from v$cell_state
where xmlexists('/cell_stats/stats/stats[@type="columnarcache"]' passing xmltype(STATISTICS_VALUE));


HIT READ BYTES
--------------------------------------------------------------------------------
1909456896

select
   xmlcast(
      xmlquery(
         '/cell_stats/stats/stats/stat[@name="columnar_cache_hits_saved_bytes"]'
         passing xmltype(STATISTICS_VALUE)
         returning content
      ) as varchar2(200)
   ) "HIT SAVED BYTES"
from v$cell_state
where xmlexists('/cell_stats/stats/stats[@type="columnarcache"]' passing xmltype(STATISTICS_VALUE));


HIT SAVED BYTES
--------------------------------------------------------------------------------
1128267776
which shows we were able to eliminate about 35% of the disk I/O for this query run!
We could, of course, have gotten that information more simply with the regular stat “cell physical IO bytes saved by columnar cache” but I wanted to show how to pull values from v$cell_state for use in scripts.
Many people only use Query High compression as they find the increased disk I/O from Query Low more than offsets the savings from cheaper decompression costs. However, with the columnar cache in place, those trade-offs have changed. It may be worth re-evaluating the decision as to when user Query Low vs. Query High particularly on CPU-bound cells.
Addendum: performance bug 20525311 affecting the columnar cache with selective predicates is fixed in the next rpm.
Roger MacNicolOracle Data Storage Technology
Create External Table as Select
I was looking through a test script and saw something I didn’t know you could do in Oracle. I mentioned it to an Oracle ACE and he didn’t know it either. I then said to the External Table engineers “Oh I see you’ve added this cool new feature” and he replied dryly – “Yes, we added it in Oracle 10.1”. Ouch! So just in case you also didn’t know, you can create an External Table using a CTAS and the ORACLE_DATAPUMP driver.
This feature only work with the ORACLE_DATAPUMP access driver (it does NOT work with with the LOADER, HIVE, or HDFS drivers) and we can use it like this:
SQL> create table cet_test organization external
  2  (
  3    type ORACLE_DATAPUMP
  4    default directory T_WORK
  5    location ('xt_test01.dmp','xt_test02.dmp')
  6  ) parallel 2
  7  as select * from lineitem

Table created.
Checking the results shows us
-rw-rw---- ... 786554880 Mar 9 10:48 xt_test01.dmp
-rw-rw---- ... 760041472 Mar 9 10:48 xt_test02.dmp
This can be a great way of creating a (redacted) sample of data to give to a developer to test or for a bug repro to give to support or to move between systems.
Correct syntax for the table_stats hint
A friend contacted me to ask why they were having problems using the table_stats hint to influence optimizer decision making and also to influence the decision to use direct read or buffer cache scan so this is just a quick blog post to clarify the syntax as it is not well documented.
table_stats(<table_name> <method> {<keyword>=<value>} )

Method is one of: DEFAULT, SET, SCALE, SAMPLE

Keyword is one of: BLOCKS, ROWS, ROW_LENGTH
The most useful methods are SET which does for statement duration what dbms_stats.set_table_stats does globally; and SCALE which acts to scale up the current size of the segment and can therefore be used to try what if scenarios on the segment growing on performance
For example:
select /*+ table_stats(scott.emp set rows=14 blocks=1 row_length=10) */ * from scott.emp;
Since this is a table scan blog, let’s look at the impact on table scans. Using the Scale 1 customers table with 150,000 rows
SQL> exec dbms_stats.gather_table_stats(USER,'RDM');

SQL> select sum(BLOCKS) from user_segments where segment_name='RDM';
SUM(BLOCKS)
-----------
       1792
and use trace events
event="trace[NSMTIO] disk medium"                  # Direct I/O decision making
event="10358 trace name context forever, level 2"  # Buffer cache decision making
We see this segment is smaller than the small table threshold for this buffer cache (kcbstt=9458) and so decision making is short-circuited and will use the buffer cache :
kcbism: islarge 0 next 0 nblks 1689 type 2, bpid 3, kcbisdbfc 0 kcbnhl 8192 kcbstt 9458 keep_nb 0 kcbnbh 461198 kcbnwp 1 kcbpstt 0, BCRM_ON 0
NSMTIO: qertbFetch:NoDirectRead:[- STT < OBJECT_SIZE < MTT]:Obect's size: 1689 (blocks), Threshold: MTT(46119 blocks),
Now let’s try the same query with the hint shown in the example above:
kcbism: islarge 1 next 0 nblks 66666666 type 2, bpid 3, kcbisdbfc 0 kcbnhl 8192 kcbstt 9458 keep_nb 0 kcbnbh 461198 kcbnwp 1 kcbpstt 0, BCRM_ON 0
kcbimd: nblks 66666666 kcbstt 9458 kcbnbh 46119 bpid 3 kcbisdbfc 0 is_medium 0
kcbivlo: nblks 66666666 vlot 500 pnb 461198 kcbisdbfc 0 is_large 1
NSMTIO: qertbFetch:DirectRead:[OBJECT_SIZE>VLOT]
NSMTIO: Additional Info: VLOT=2305990
Object# = 75638, Object_Size = 66666666 blocks
Now the size of the table in blocks is far larger than our small table threshold so we go on to evaluate whether it is a medium table and it is too large to be considered medium (cutoff is 10% cache i.e. kcbnbh=46119 blocks) so then it is evaluated as a very large table and that is true so direct read will be used.
Making the new value permanentIf for some reason we wanted to make some value permanent (caveat emptor) after doing experiments with the hint, we can set the table stats like this:
BEGIN
  DBMS_STATS.SET_TABLE_STATS(
    ownname => 'TPCH'
  , tabname => 'RDM'
  , numrows => 2000000
  , numblks => 10000 );
END;

SQL>  select NUM_ROWS,BLOCKS,EMPTY_BLOCKS from DBA_TAB_STATISTICS where TABLE_NAME='RDM';

NUM_ROWS     BLOCKS EMPTY_BLOCKS
---------- ---------- ------------
   2000000     10000             0
and now we see the size we decided upon after the needed experiments being used without a hint:
kcbism: islarge 1 next 0 nblks 10000 type 2, bpid 3, kcbisdbfc 0 kcbnhl 8192 kcbstt 9458 keep_nb 0 kcbnbh 461198 kcbnwp 1 kcbpstt 0, BCRM_ON 0
kcbimd: nblks 10000 kcbstt 9458 kcbnbh 46119 bpid 3 kcbisdbfc 0 is_medium 1
kcbcmt1: hit age_diff adjts last_ts nbuf nblk has_val kcbisdbfc cache_it 191 23693 23502 461198 10000 1 0 1
NSMTIO: qertbFetch:NoDirectRead:[- STT < OBJECT_SIZE < MTT]:Obect's size: 10000 (blocks), Threshold: MTT(46119 blocks),
Our table is no longer small as 10,000 blocks is larger than STT=9458 blocks so it is a medium table but as it is smaller than the medium table threshold it will still use the buffer cache.
I hope you found this useful.
Roger
Controlling the offload of specific operators
One of the joys of regexp is that you can write a pattern that is painfully expensive to match and offloading these to the cell can cause significant impact on other users and overall throughput (including heartbeat issues). If you have a user who is prone to writing bad regexp expressions you as DBA can prevent regexp (or any other operator) from being offloaded to the cells.
Let’s take a very simple example using a cut down version of TPC-H Query 16 and a NOT LIKE predicate:
SQL> explain plan for select p_brand, p_type, p_size
from part
where p_brand <> 'Brand#45'
and p_type not like 'MEDIUM POLISHED%'
and p_size in (49, 14, 23, 45, 19, 3, 36, 9)
group by p_brand, p_type, p_size;

SQL> select * FROM TABLE(DBMS_XPLAN.DISPLAY);

  |*  3 |    TABLE ACCESS STORAGE FULL| PART | 29833 |  1048K|    |   217   (2)| 00:00:01 |  1 |  8
------------------------------------------------------------------------------------------------------------
      3 - storage(("P_SIZE"=3 OR "P_SIZE"=9 OR "P_SIZE"=14 OR "P_SIZE"=19
      OR "P_SIZE"=23 OR "P_SIZE"=36 OR "P_SIZE"=45 OR "P_SIZE"=49)
      AND "P_BRAND"<>'Brand#45' AND "P_TYPE" NOT LIKE 'MEDIUM POLISHED%')
Here we see all the predicates get offloaded as expected. So, for example, to stop NOT LIKE being offloaded we would need to find the operator in v$sqlfn_metadata
SQL> column descr format a18
SQL> select func_id, descr, offloadable from v$sqlfn_metadata where descr like '%LIKE%';

   FUNC_ID DESCR              OFF
---------- ------------------ ---
        26  LIKE              YES
        27  NOT LIKE          YES
        99  LIKE              NO
       120  LIKE              YES
       121  NOT LIKE          YES
       ...
       524  REGEXP_LIKE       YES
       525  NOT REGEXP_LIKE   YES
       537  REGEXP_LIKE       YES
       538  NOT REGEXP_LIKE   YES
we can ignore all but the two basic LIKE operators in this case, so to disable the offload of our LIKE predicates we use:
SQL> alter session set cell_offload_parameters="OPT_DISABLED={26,27};";
and we see this reflected in the offloadable column in v$sqlfn_metadata.
SQL> select func_id, descr, offloadable from v$sqlfn_metadata where descr like '%LIKE%';

   FUNC_ID DESCR              OFF
---------- ------------------ ---
        26  LIKE              NO
        27  NOT LIKE          NO
        99  LIKE              NO
       120  LIKE              YES
       121  NOT LIKE          YES
To re-enable them you would use:
SQL> alter session set cell_offload_parameters="OPT_DISABLED={};";
One thing to note about this param is that it doesn’t work like events (whose settings are additive), here it replaces the previous value and so every operator you want disabled has to be included in the same alter session (and the param is limited to 255 maximum characters limiting the number of operators that can be disabled). With the offload of LIKE and NOT LIKE disabled we can see the impact on the plan:
SQL> explain plan for select p_brand, p_type, p_size
from part
where p_brand <> 'Brand#45'
and p_type not like 'MEDIUM POLISHED%'
and p_size in (49, 14, 23, 45, 19, 3, 36, 9)
group by p_brand, p_type, p_size;

SQL> select * FROM TABLE(DBMS_XPLAN.DISPLAY);

 |*  3 |    TABLE ACCESS STORAGE FULL| PART | 29833 |  1048K|    |   217   (2)| 00:00:01 |  1 |  8
------------------------------------------------------------------------------------------------------------

     3 - storage(("P_SIZE"=3 OR "P_SIZE"=9 OR "P_SIZE"=14 OR "P_SIZE"=19 OR "P_SIZE"=23
     OR "P_SIZE"=36 OR "P_SIZE"=45 OR "P_SIZE"=49) AND "P_BRAND"<>'Brand#45')
and the NOT LIKE is no longer in the storage filter. Now lets say that you as DBA are faced with a more complex problem and want to halt all complex processing on the cells temporarily. There is a parameter that will disable everything except the simple comparison operators and NULL checks:
SQL> alter session set "_cell_offload_complex_processing"=FALSE;
Now lets see what happens:
SQL> explain plan for select p_brand, p_type, p_size
from part
where p_brand <> 'Brand#45'
and p_type not like 'MEDIUM POLISHED%'
and p_size in (49, 14, 23, 45, 19, 3, 36, 9)
group by p_brand, p_type, p_size;

SQL> select * FROM TABLE(DBMS_XPLAN.DISPLAY);

 |*  3 |    TABLE ACCESS STORAGE FULL| PART | 29833 |  1048K|    |   217   (2)| 00:00:01 |  1 |  8
------------------------------------------------------------------------------------------------------------

    3 - filter(("P_SIZE"=3 OR "P_SIZE"=9 OR "P_SIZE"=14 OR "P_SIZE"=19 OR "P_SIZE"=23
    OR "P_SIZE"=36 OR "P_SIZE"=45 OR "P_SIZE"=49) AND "P_BRAND"<>'Brand#45'
    AND "P_TYPE" NOT LIKE 'MEDIUM POLISHED%')
Well we got no storage predicates at all and we didn’t expect that because we had one simple predicate namely p_brand != 'Brand#45' and the IN predicate had been rewritten to a series of OR’ed comparisons so what happened? This parameter only permits simple predicates that are linked by AND’s and can be attached directly to one column. Disjuncts are not pushable so they are normally evaluated by an eva tree or by pcode neither of which are sent to the cell with this parameter set to FALSE. So why wasn’t our one simple predicate offloaded. Well, note where it is in the explain plan. It comes after the rewritten the IN and since the predicates are sorted by the optimizer on effectiveness we stop looking as soon as we see one that can’t be offloaded. Let’s remove the IN and see what happens:
SQL> explain plan for select  p_brand, p_type, p_size
from part
where p_brand <> 'Brand#45'
and p_type not like 'MEDIUM POLISHED%';

|*  2 |   TABLE ACCESS STORAGE FULL| PART |   190K|  6686K|   217   (2)| 00:00:01 | 1 | 8 |
---------------------------------------------------------------------------------------------------

    2 - storage("P_BRAND"<>'Brand#45')
       filter("P_BRAND"<>'Brand#45' AND "P_TYPE" NOT LIKE 'MEDIUM POLISHED%')
as expected the simple predicate is now offloaded. If you look at v$sqlfn_metadata you’ll see this param is reflected in the offloadable column:
SQL> select func_id, descr, offloadable from v$sqlfn_metadata where descr like '%LIKE%';

   FUNC_ID DESCR              OFF
---------- ------------------ ---
        26  LIKE              NO
        27  NOT LIKE          NO
        99  LIKE              NO
       120  LIKE              NO
       ...
       121  NOT LIKE          NO
       524  REGEXP_LIKE       NO
       525  NOT REGEXP_LIKE   NO
       537  REGEXP_LIKE       NO
       538  NOT REGEXP_LIKE   NO
I hope you never need any of this in real life but it’s good to have it in the toolbag.
Alter Table Shrink Space and SmartScan
There are three main tools available for cleaning up a segment (Alter Table Shrink, Alter Table Move, and export/import), but one of them isn’t as helpful as you might have thought.
Consider the following sequence of events where we update the 256th column to cause widespread fragmentation:
SQL> update t set c256 = 'abcdefghijklmnopqrstuvwxyz';
2000000 rows updated.
SQL> commit;
Commit complete.

SQL> analyze table t compute statistics;
Table analyzed.

SQL> select chain_cnt from dba_tables where table_name = 'T' and owner = 'FUSION';
CHAIN_CNT
----------
   2000000

SQL> select sum(blocks) from user_segments where segment_name = 'T';

SUM(BLOCKS)
-----------
     139264
SQL> alter table t enable row movement;
Table altered.
SQL> alter table t shrink space cascade;
Table altered.
SQL> analyze table t compute statistics;
Table analyzed.

SQL> select chain_cnt from dba_tables where table_name = 'T' and owner = 'FUSION';

CHAIN_CNT
----------
   1970068

1 row selected.
Note: ‘chain_cnt” does not count chained rows, rather it counts rows whose row pieces are chained across more than one block. A Row that is in three pieces but all three pieces are in the same block has a zero chain_cnt.
In this particular artificial scenario Shrink has not gained us much reduction in space used, and more importantly it hasn’t reduced the kind of fragmentation that affects SmartScan performance.
This is because Shrink works in two phases. In Phase 1, the segment is scanned down from the end of the segment to the beginning. Rows with their head piece in the currently scanned block are moved together with all their row pieces. The segment is scanned from beginning upwards looking for space for the entire row. When it is unable to move any more entire rows, Phase 2 starts scanning down again from the end of the segment trying to move individual row pieces to blocks with space. This meant that while Phase 1 could potentially reduce chaining for relocated rows, Phase 2 was very unlikely to reduce the chain count and could in fact increase the chain_cnt. The moral of this is that Shrink really is for freeing up blocks close to the High Water Mark and not for cleaning up fragmented rows.
Now let’s try Alter Table move with the same segment:
SQL> alter table t move;

Table altered.

SQL> analyze table t compute statistics;
Table analyzed.

SQL> select chain_cnt from dba_tables where table_name = 'T' and owner = 'FUSION';
CHAIN_CNT
----------
     45976
1 row selected.

SQL> select sum(blocks) from user_segments where segment_name = 'T';

SUM(BLOCKS)
-----------
      92160
1 row selected.
OK, that did what we hoped: more space has been reclaimed but more importantly for SmartScan, the number of fragmented rows has been reduced considerably.
With the fix for 19433200, the mechanics of Shrink have been reworked and it is now better at reducing the chain_cnt. However, even with the improvements made, when faced with heavily fragmented rows, Alter Table Move or export/import are likely to provide significantly better table scan performance with SmartScan.
Roger MacNicol
Oracle Data Storage Technology
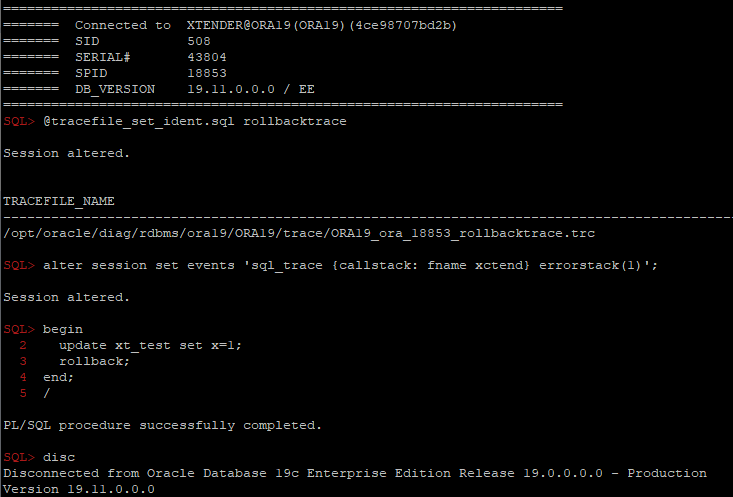
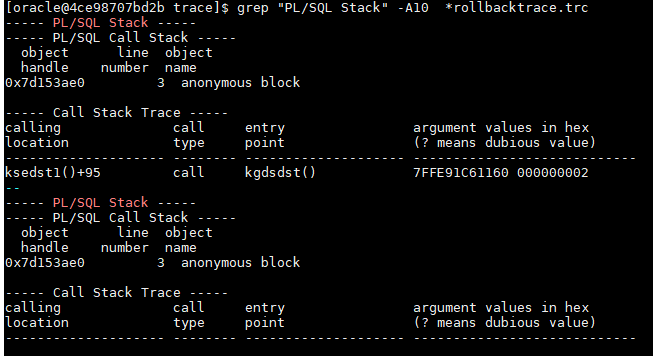
Where does the commit or rollback happen in PL/SQL code?
One of the easiest ways is to use diagnostic events:
alter session set events 'sql_trace {callstack: fname xctend} errorstack(1)';
Another interesting troubleshooting case
Got an interesting question today in RuOUG:
Some very simple PL/SQL procedures usually are completed within ~50ms, but sometimes sporadically longer than a second. For example, the easiest one from these procedures:
create or replace PROCEDURE XXXX (
  P_ORG_NUM IN number,
  p_result OUT varchar2,
  p_seq OUT number
) AS
BEGIN
  p_seq := P_ORG_NUM; p_result:='';
END;
sql_trace shows that it was executed for 1.001sec and all the time was “ON CPU”:
Trace file /opt/oracle/diag/rdbms/rdb4/rdb/trace/rdb_ora_7100.trc
Oracle Database 19c Enterprise Edition Release 19.0.0.0.0 - Production
Version 19.10.0.0.0
Build label:    RDBMS_19.10.0.0.0DBRU_SOLARIS.SPARC64_210107
ORACLE_HOME:    /opt/oracle/product/19
System name:	SunOS
Node name:	node2.zzzzz.ru
Release:	5.11
Version:	11.3
Machine:	sun4v
Oracle process number: 137
Unix process pid: 7100, image: oracle@node2.zzzzz.ru

*** 2021-05-26T15:38:31.321550+03:00
*** SESSION ID:(68.47940) 2021-05-26T15:38:31.321609+03:00
*** CLIENT ID:() 2021-05-26T15:38:31.321633+03:00
*** SERVICE NAME:(SYS$USERS) 2021-05-26T15:38:31.321656+03:00
*** MODULE NAME:(JDBC Thin Client) 2021-05-26T15:38:31.321679+03:00
*** ACTION NAME:() 2021-05-26T15:38:31.321703+03:00
*** CLIENT DRIVER:(jdbcthin : 19.3.0.0.0) 2021-05-26T15:38:31.321728+03:00

=====================
PARSING IN CURSOR #18446744071368904384 len=53 dep=0 uid=51 oct=47 lid=51 tim=190436799743741 hv=804128640 ad='12345678' sqlid='aabbaabbaa123'
BEGIN AAAA.XXXX(:1 ,:2 ,:3 ); END;
END OF STMT
PARSE #18446744071368904384:c=28,e=28,p=0,cr=0,cu=0,mis=0,r=0,dep=0,og=1,plh=0,tim=190436799743741
BINDS #18446744071368904384:

 Bind#0
  oacdty=02 mxl=22(22) mxlc=00 mal=00 scl=00 pre=00
  oacflg=03 fl2=1000000 frm=01 csi=873 siz=24 off=0
  kxsbbbfp=ffffffff747c6c98  bln=22  avl=02  flg=05
  value=6
 Bind#1
  oacdty=01 mxl=32767(32767) mxlc=00 mal=00 scl=00 pre=00
  oacflg=03 fl2=1400010 frm=01 csi=873 siz=32767 off=0
  kxsbbbfp=ffffffff747b8020  bln=32767  avl=00  flg=05
 Bind#2
  oacdty=02 mxl=22(22) mxlc=00 mal=00 scl=00 pre=00
  oacflg=03 fl2=1400000 frm=01 csi=873 siz=24 off=0
  kxsbbbfp=ffffffff747c6c68  bln=22  avl=00  flg=05

*** 2021-05-26T15:38:33.172899+03:00
WAIT #18446744071368904384: nam='SQL*Net message to client' ela= 3 driver id=1413697536 #bytes=1 p3=0 obj#=-1 tim=190436800744970
EXEC #18446744071368904384:c=1104,e=1001110,p=0,cr=0,cu=0,mis=0,r=1,dep=0,og=1,plh=0,tim=190436800745125
XCTEND rlbk=0, rd_only=1, tim=190436800745192
Originally I asked for dtrace/flamegraph and got just this:
              unix`_resume_from_idle+0x280
              genunix`cv_timedwait_sig_hires+0x1c4
              genunix`cv_waituntil_sig+0x90
              genunix`nanosleep+0xd4
              unix`syscall_trap+0x228

              0xffffffff7c04dbcc
              0xffffffff7c0393ec
              0xffffffff7c02e084
              0xffffffff7c02f860
              0x1176ef724
              0x118376518
              0x118366b84
              0x118365d14
              0x118366078
              0x118314b60
              0x1183973cc
              0x1182c707c
              0x1102edef8
              0x10aa60064
              0x10c224038
              0x10aa50ca8
              0x115bbc370
              0x10aa196dc
              0x10aa2c59c
              0x10aa50ca8
  ns
           value  ------------- Distribution ------------- count
       268435456 |                                         0
       536870912 |@@@@@@@@@@@@@@@@@@@@@@@@@@@@@@@@@@@@@@@@ 1
      1073741824 |                                         0
But truss showed much more interesting details:
 0.000037    write(11, "   B i n d # 2\n", 8)           = 8
 0.000045    write(12, " 2 0 m 7 } M X 8\n", 9)         = 9
 0.000022    lseek(11, 0, SEEK_CUR)                             = 4673
 0.000038    write(11, "     o a c d t y = 0 2  ".., 104)       = 104
 0.000040    write(12, " 2 0 m N } 5 Y e 1\n", 10)              = 10
 0.000020    lseek(11, 0, SEEK_CUR)                             = 4777
 0.000037    write(11, "     k x s b b b f p = f".., 52)        = 52
 0.000038    write(12, " 2 0 m 7 } j Y q\n", 9)         = 9
 0.000028    pathconf("/tmp/", _PC_NAME_MAX)                    = 255
 0.000029    open("/tmp/.SHMLPESLD_rdb4_26_000000047334dc80", O_RDWR|O_CREAT|O_EXCL|O_NOFOLLOW|O_CLOEXEC, 0666) Err#17 EEXIST
 1.000029    nanosleep(0xFFFFFFFF7FFF5FF0, 0xFFFFFFFF7FFF5FE0) = 0
 0.000038    open("/tmp/.SHMLPESLD_rdb4_26_000000047334dc80", O_RDWR|O_CREAT|O_EXCL|O_NOFOLLOW|O_CLOEXEC, 0666) = 13
 0.000023    close(13)                                  = 0
 0.000026    open("/tmp/.SHMDPESLD_rdb4_26_000000047334dc80", O_RDONLY|O_NOFOLLOW|O_CLOEXEC) = 13
 0.000028    unlink("/tmp/.SHMLPESLD_rdb4_26_000000047334dc80") = 0
 0.000052    mmap(0x00000000, 528, PROT_READ|PROT_EXEC, MAP_PRIVATE, 13, 0) = 0xFFFFFFFF74700000
 0.000020    close(13)                                  = 0
 0.000023    lseek(11, 0, SEEK_CUR)                             = 4829
 0.000044    write(11, "\n * * *   2 0 2 1 - 0 5".., 38)        = 38
 0.000040    write(12, " - T + 7 } d b k t . c *".., 16)        = 16
 0.000020    lseek(11, 0, SEEK_CUR)                             = 4867
 0.000037    write(11, " W A I T   # 1 8 4 4 6 7".., 130)       = 130
 0.000037    write(12, " 8 4 j U 1 y 5 $ o 7 2 2".., 18)        = 18
 0.000020    lseek(11, 0, SEEK_CUR)                             = 4997
 0.000037    write(11, " E X E C   # 1 8 4 4 6 7".., 105)       = 105
 0.000037    write(12, " 8 0 j d 0 y 5 $ k x s t".., 20)        = 20
 0.000022    lseek(11, 0, SEEK_CUR)                             = 5102
As you can see it calls nanosleep in the line #11 and sleeps 1 sec, but more interesting a line before and a few after nanosleep: oracle tries to open (and fails “err17”) a file "/tmp/.SHMLPESLD_rdb4_XXX” , which means that it tries to open a pl/sql procedure compiled in native mode (pesld – Plsql code Execution Shared object manager native code Loader). I’ve asked to check compilation parameters of the procedure, and it was really compiled in native mode:
PLSQL_OPTIMIZE_LEVEL 2
PLSQL_CODE_TYPE NATIVE
PLSQL_DEBUG FALSE
So obvious workaround to recompile those procedures in the INTERPRETED mode fixed the issue.
UPDATE: Forgot to show what exactly is going on here: Finally I got normal stack:
              unix`_resume_from_idle+0x280
              genunix`cv_timedwait_sig_hires+0x1c4
              genunix`cv_waituntil_sig+0x90
              genunix`nanosleep+0xd4
              unix`syscall_trap+0x228

              libc.so.1`__nanosleep+0x4
              libc.so.1`sleep+0x14
              libc.so.1`__pos4obj_lock+0x68
              libc.so.1`shm_open+0x50
              oracle`pesld02_Map_Object+0xbc4
              oracle`penglur+0x1d18
              oracle`pfrins+0x8e4
              oracle`pfri7_inst_body_common+0x214
              oracle`pfri3_inst_body+0x18
              oracle`pfrrun+0x9e0
              oracle`plsql_run+0x22c
              oracle`peicnt+0xfc
              oracle`kkxexe+0x2f8
              oracle`opiexe+0x5784
              oracle`kpoal8+0x918
              oracle`opiodr+0x448
              oracle`ttcpip+0x430
              oracle`opitsk+0x83c
              oracle`opiino+0x39c
              oracle`opiodr+0x448
  ns
           value  ------------- Distribution ------------- count
       268435456 |                                         0
       536870912 |@@@@@@@@@@@@@@@@@@@@@@@@@@@@@@@@@@@@@@@@ 3
      1073741824 |                                         0
As you can see pesld02_Map_Object is trying to load (map) a user-defined function (native compilation) and calls shm_open which calls __pos4obj_lock and if we look at it, we can find why and when it calls sleep(which calls nanosleep internally):
int
__pos4obj_lock(const char *name, const char *ltype)
{
 char *dfile;
 int fd;
 int limit = 64;

 if ((dfile = __pos4obj_name(name, ltype)) == NULL) {
  return (-1);
 }

 while (limit-- > 0) {
  if ((fd = __open_nc(dfile, O_RDWR | O_CREAT | O_EXCL, 0666))
      < 0) {
   if (errno != EEXIST)
    break;
   (void) sleep(1);
   continue;
  }

  (void) __close_nc(fd);
  free(dfile);
  return (1);
 }

 free(dfile);
 return (-1);
}
SQL*Plus tips #9: Reading traces and incident files
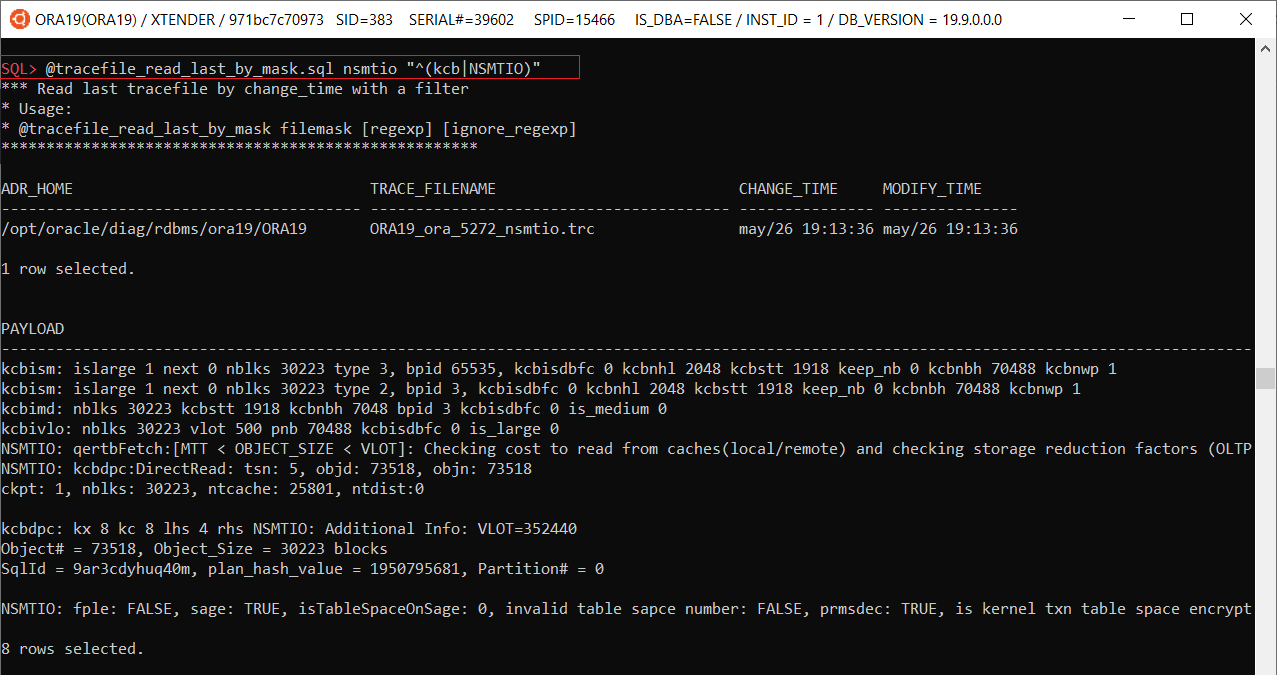
@tracefile_read_last_by_mask filemask [regexp] [ignore_regexp]
– finds last trace by filemask and filters rows by regexp and filters out rows by ignore_regexp:
@ tracefile_by_mask.sql [mask] – finds and shows last 10 trace files by mask

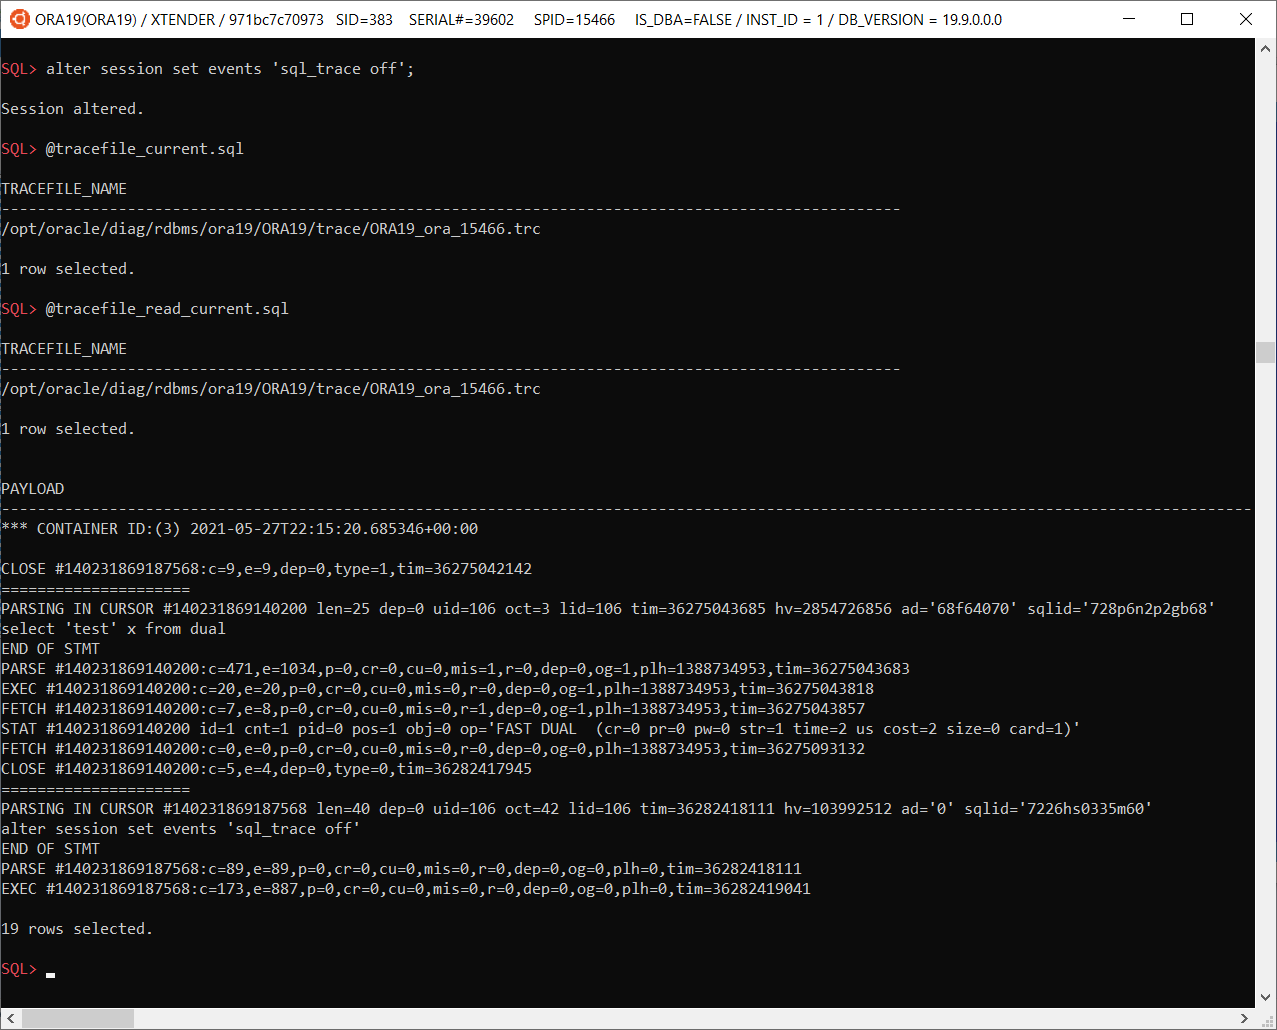
@tracefile_current – shows a file name of the your session’s trace file
@tracefile_read_current – reads a trace file of the current session
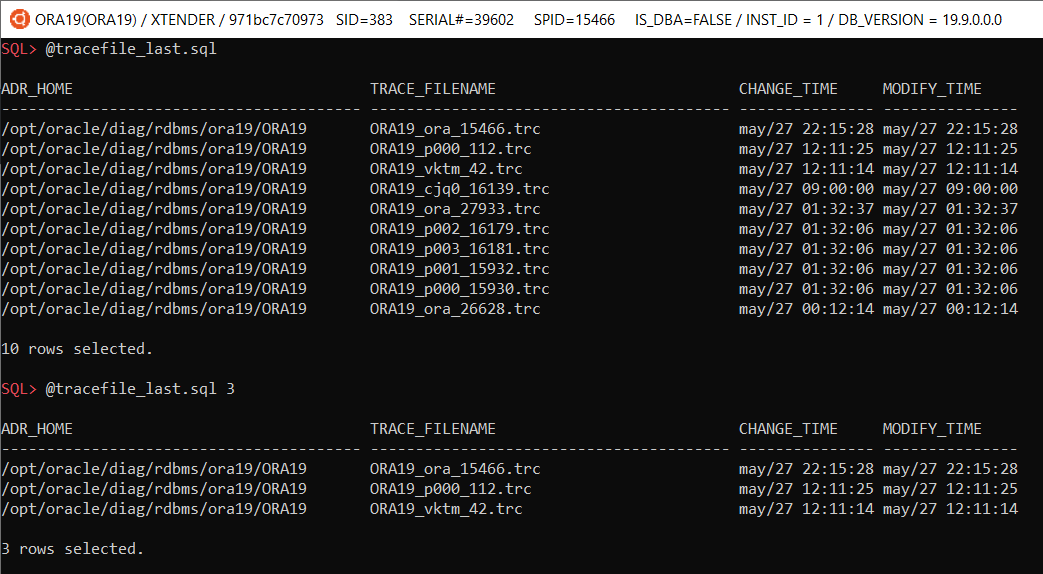
@tracefile_last [n] – shows last N trace files (by default 10)
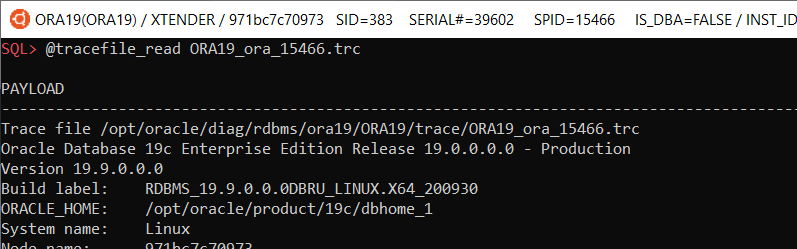
@tracefile_read filename – reads a specified trace file
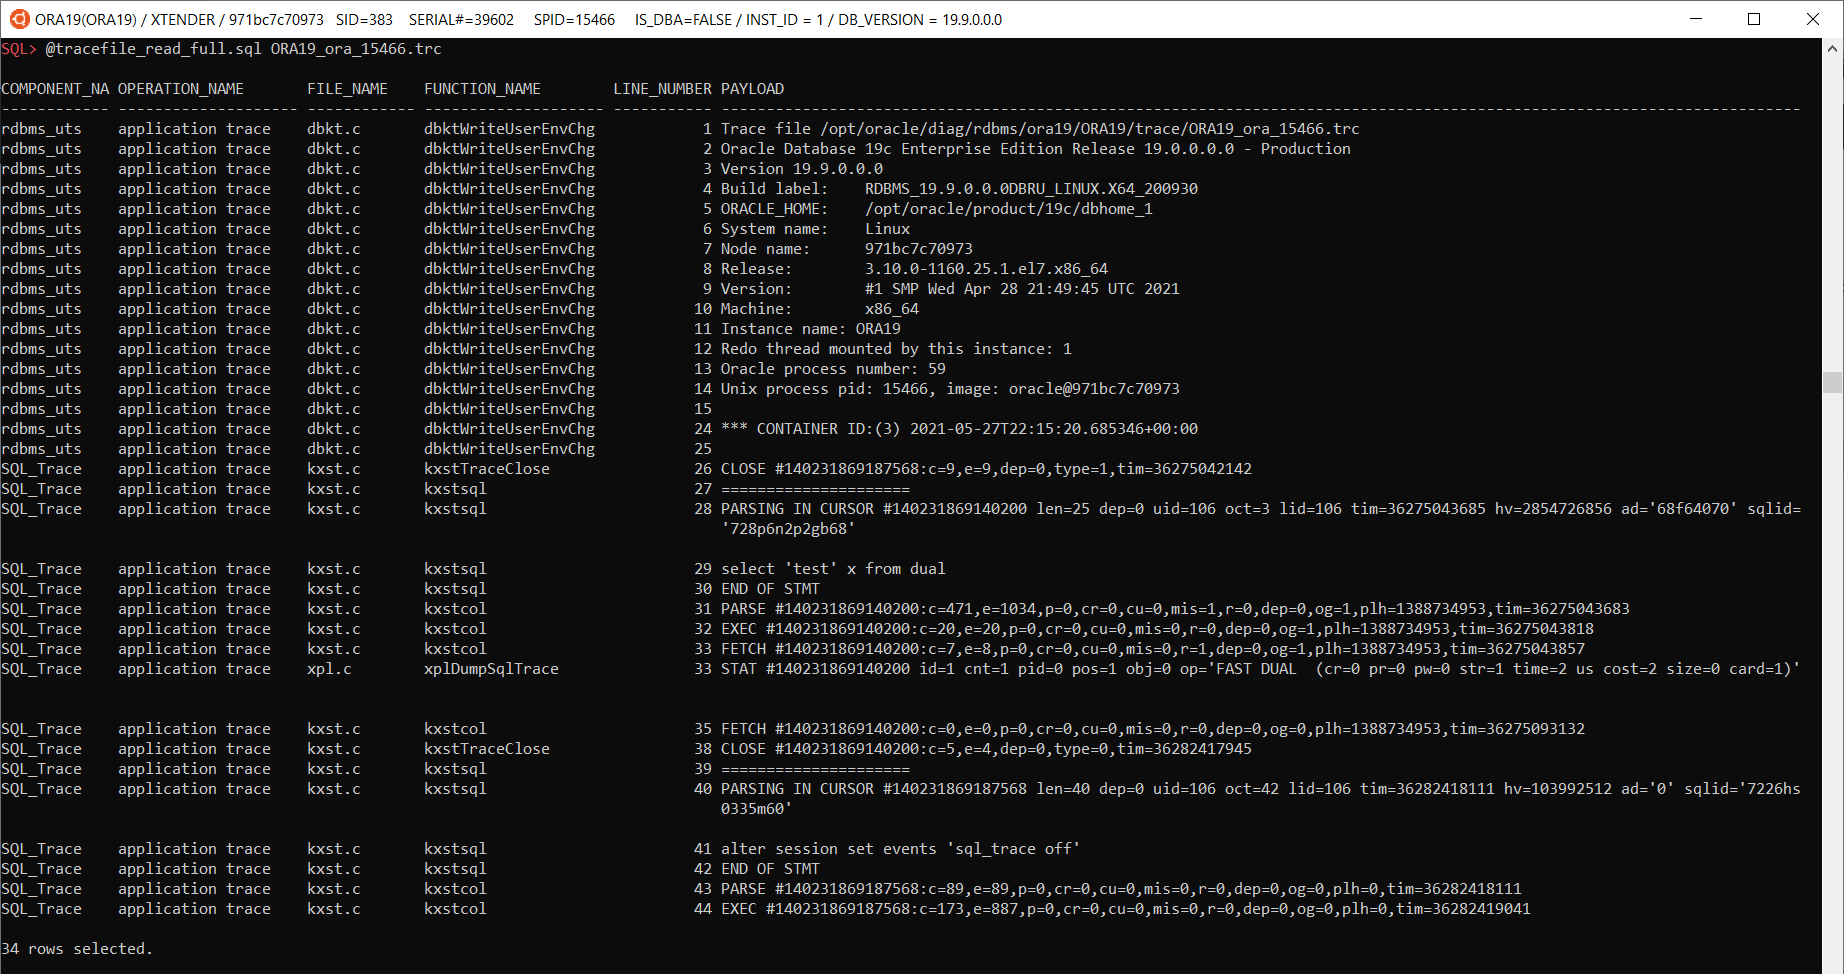
@tracefile_read_full.sql <filename> – reads a specified trace file and shows it with additional columns: component_name, operation_name, file_name, function_name
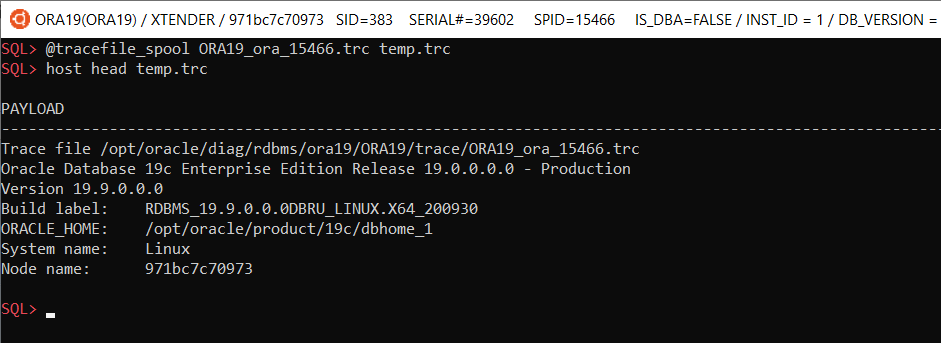
@tracefile_spool <tracefilename> <dest_file> – saves tracefilename to dest_file on local machine:
 Incidents, problems and incident files
@diag/problems_last.sql [N] – shows last N problems, N is optional, by default shows last 10 problems

@diag/incidents_last.sql [N] – shows last N incidents (by default 10)

@diag/incidents_by_problem.sql <problem_id> [N] – shows last N incidents by problem_id

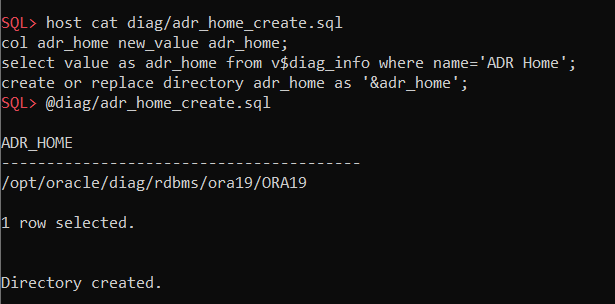
@diag/adr_home_create.sql – creates a directory object for reading incident files:
@diag/incident_files_by_mask.sql filemask – shows incident file names by file mask
SQL> @diag/incident_files_by_mask.sql %incident%387.%

INCIDENT_ID   OWNER_ID      FLAGS CON_ID BFILE
----------- ---------- ---------- ------ ------------------------------------------------------------
      26387          1          1      3 <ADR_HOME>/incident/incdir_26387/ORA19_ora_2942_i26387.trc#0

1 row selected.
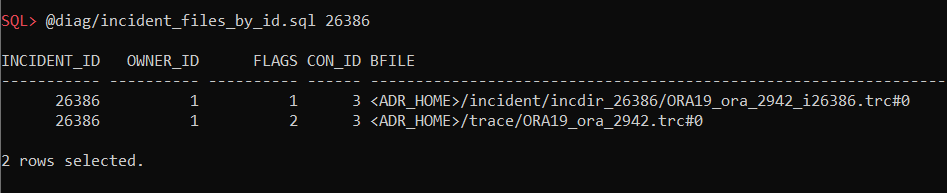
@diag/incident_files_by_id.sql incident_id – shows incident files by incident_id
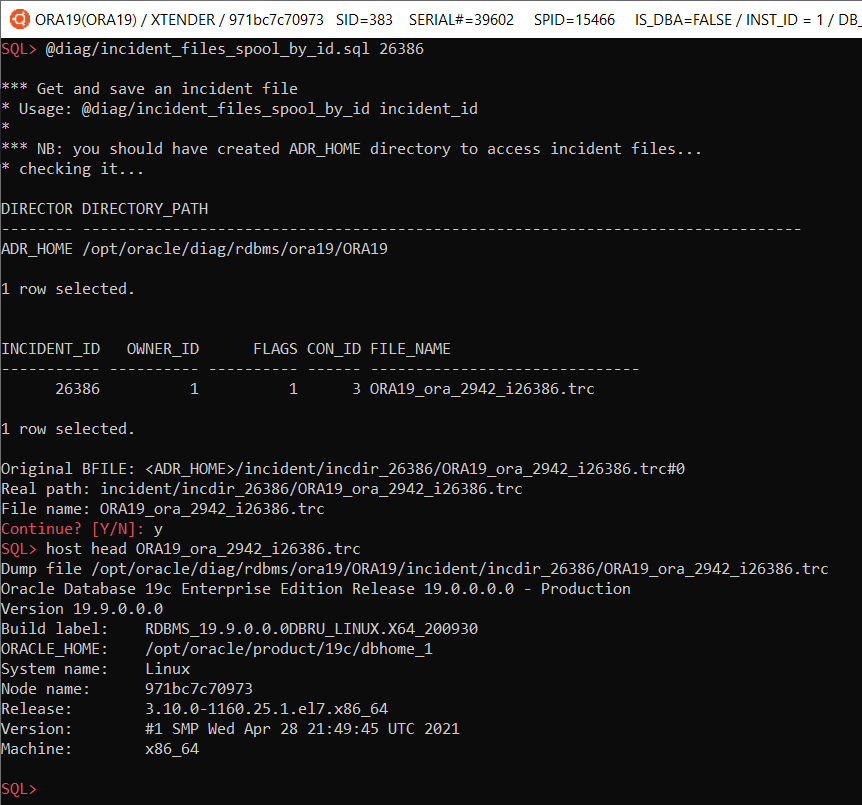
@diag/incident_files_spool_by_id.sql incident_id – saves an incident file on local machine:
Oracle diagnostic events — Cheat sheet
Oracle diagnostic events is a great feature, but unfortunately poorly documented and nonintuitive, so it’s difficult to remember all events/actions/parameters and even read its internal documentation using oradebug. So I decided to compile its internal doc as a more convenient html-version (http://orasql.org/files/events/) and make a cheat sheet of some unknown or little-known use cases.
alter system set events
   'kg_event[1476]
        {occurence: start_after 1, end_after 3}
            trace("stack is: %\n", shortstack())
            errorstack(2)
    ';
- kg_event[errno] – Kernel Generic event in library Generic for error number events, which instructs to trace ORA-errno errors;
- {occurence: start_after X, end_after Y} – is a filter, which instructs to skip X event checks and trace just Y times;
- trace(format, str1, str2, …, str15) – is a function from ACTIONS for printing into a trace file;
- shortstack() – is a function from ACTIONS , which returns a short call stack as a string;
- errorstack(level) – is a function from ACTIONS, which prints extended info (level: 0 – errorstack only, 1 – errorstack + call stack, 2 – as level 1 + processtate, 3 – as level 2 + context area). You can get more details with PROCESSSTATE or SYSTEMSTATE. If you need just a call stack, you can use CALLSTACK(level) , with function arguments in case of level>1.
alter system set events
    'trace[SQL_Compiler.* | SQL_Execution.*]
        [SQL: ...]
            {process: ospid = ...}
            {occurence:end_after 3}
                controlc_signal()';
- trace[component] – is the main diagnostic event, which allows to specify Components to trace. This command shows how to specify all child components of SQL_Compiler and SQL_Execution.
- SQL[SQL: sqlid ] – is the only SCOPE in library RDBMS, which allows to trace specific SQL_ID and all its recursive calls (or for example, if you specify sql_id of a PL/SQL call, then all its internal queries will be traced too);
- {process: …} – is a filter, which allows to filter processes;
- controlc_signal – is an ACTION, that raises “ORA-01013: user requested cancel of current operation”, ie it’s like this session interrupted own call.
I’ve used this command recently when I had to help developers to find where some suboptimal and unnecessary queries, discovered during performance load testing, come from their code (huge webapp with hibernate).
alter system set events
    'sql_trace {process: ospid = ...}
     trace("sqlid(%): %\n", sqlid(), evfunc())
     ';
sql_trace – is just a good old trace event #10046, and this function forces oracle to print a function name and sql_id for each sql_trace event. Simple example:
 enabling the event
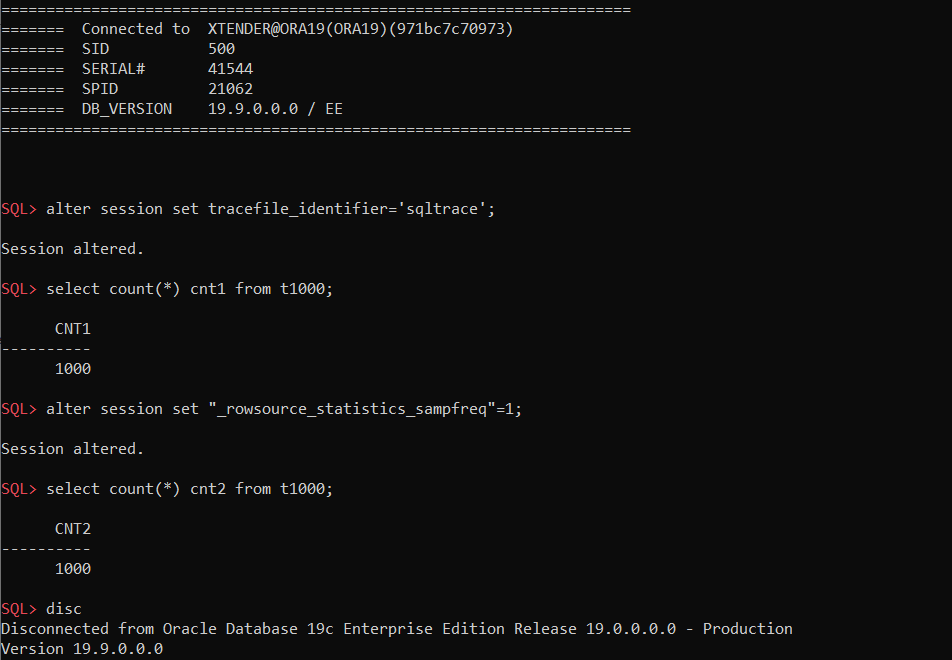 executing a query twice: with default parameters and with _rowsource_statistics_sampfreq=1
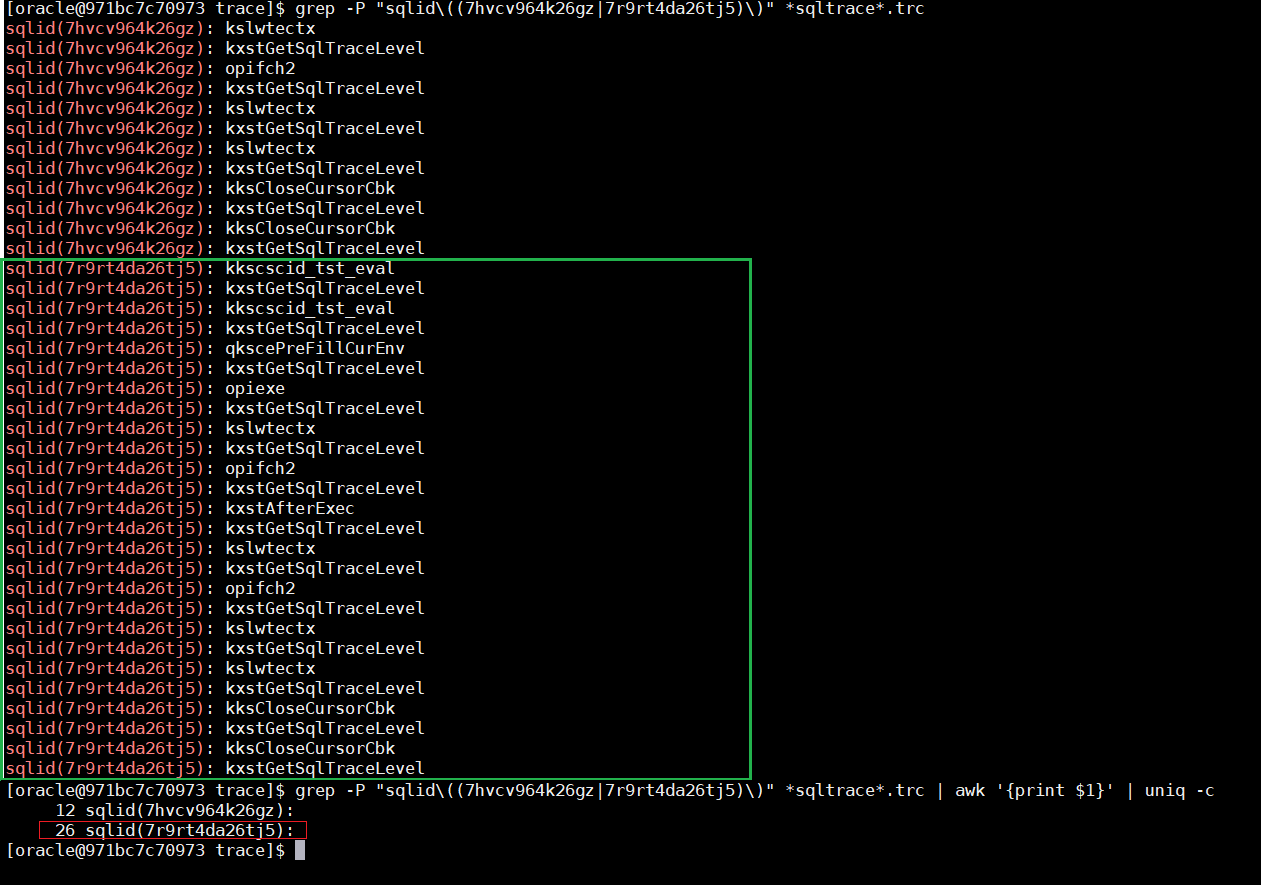 The difference is noticeable: 12 vs 26 traced events
As you can see we get 26 “occurrences” in case of “_rowsource_statistics_sampfreq”=1 instead just 12 by default. More details about this here: https://alexanderanokhin.com/2012/12/24/timing-rowsource-statistics-part-2-overhead-and-inconsistent-time/
alter system set events
    'wait_event["enq: TM - contention"]
        {wait: minwait=1000}
            errorstack(1)
            trace("event=[%] sqlid=%, ela=% p1=% p2=% p3=%\n",
                   evargs(5), sqlid(), evargn(1), evargn(2), evargn(3), evargn(4))
    ';
- wait_event[name] – event to control wait event post-wakeup actions, first argument is a wait event name, all wait event names and their parameters (P1,P2,P3) you can find in v$event_name:
select
   wait_class,name
  ,parameter1,parameter2,parameter3
  ,display_name
from v$event_name;
- {wait: … } – is a filter that allows to specify both the minimum wait time(ms) and parameters P1, P2, P3. For example, for this “TM-contention” wait event, P2 is “object #”, and we can specify {wait: minwait=1000; p2=12345}, ie only table TM-lock wait events on the table with object_id=12345 and longer than 1 sec;
- evargX() – functions from ACTIONs, which return event check arguments values, where 1st argument is an elapsed time(ms), 2nd-4th – parameters p1-p3, and 5th – wait event name. kg_event has own related functions – errargX().
or another example, when you need to find out which session variables have been changed: Let’s imagine someone forgot to specify nls parameters in to_number() and didn’t specify “on conversion error” clause, and some session sporadically get “ORA-01722: invalid number”:
-- original parameters:
SQL> alter session set nls_numeric_characters='.,';

Session altered.

-- all works fine...
SQL> select to_number('1,200.3','999g999d999') + 10 from dual;

TO_NUMBER('1,200.3','999G999D999')+10
-------------------------------------
                               1210.3

-- until they've been changed at some point:
SQL> alter session set nls_numeric_characters=".'";

Session altered.

-- obviously we get errors:
SQL> select to_number('1,200.3','999g999d999') + 10 from dual;
select to_number('1,200.3','999g999d999') + 10 from dual
                 *
ERROR at line 1:
ORA-01722: invalid number
There is no special view for session parameters which are not a part of v$ses_optimizer_env, but we can easily get them using MODIFIED_PARAMETERS():
alter system set events
    'kg_event[1722]
        {process: ospid=27556}
        {occurence:end_after 1}
            MODIFIED_PARAMETERS()';
And since we have v$diag_alert_ext for alert.log and v$diag_trace_file_contents for trace files, we can get them using this simple query:
select c.payload
from v$diag_trace_file_contents c
where 1=1
  and c.session_id   = &sid -- session sid
  and c.serial#      = &serial -- session serial#
  and c.section_name = 'Error Stack' -- they will be in "Error Stack"
--  and c.payload like '%nls_numeric%' -- we can filter only specific nls parameters
  and c.timestamp>systimestamp-interval'15'minute -- last 15 minutes
;

-- Results:
DYNAMICALLY MODIFIED PARAMETERS:
  nls_language             = "AMERICAN"
  nls_territory            = "AMERICA"
  nls_sort                 = "BINARY"
  nls_date_language        = "AMERICAN"
  nls_date_format          = "yyyy-mm-dd hh24:mi:ss"
  nls_currency             = "$"
  nls_numeric_characters   = ".'"
  nls_iso_currency         = "AMERICA"
  nls_calendar             = "GREGORIAN"
  nls_time_format          = "hh24:mi:ssxff"
  nls_timestamp_format     = "yyyy-mm-dd hh24:mi:ssxff"
  nls_time_tz_format       = "hh24:mi:ssxff TZR"
  nls_timestamp_tz_format  = "yyyy-mm-dd hh24:mi:ssxff TZR"
  nls_dual_currency        = "$"
  nls_comp                 = "BINARY"
  local_listener           = ""
Update: I’ve just got a question in RuOUG:
We use “Extensible Optimizer Interface“, i.e. Oracle CBO calls such code internally, which fails periodically with “ORA-06550 PL/SQL compile error”. Can we specify both “kg_event” and “sql_id” so we could get those errors with details in alert.log
Of course, simple example:
alter system set events
    'kg_event[6550]
        [sql: 5cmnpq8t0g7pd]
            {occurence: start_after 1, end_after 3}
                errorstack(3)
                incident(plserrors)
      ';
As you can see we use incident(label) here to generate an incident file (which you can easily pack and send to Oracle support or consulters) and kg_event[6550] to trace “ORA-06550: line %, column %” errors.
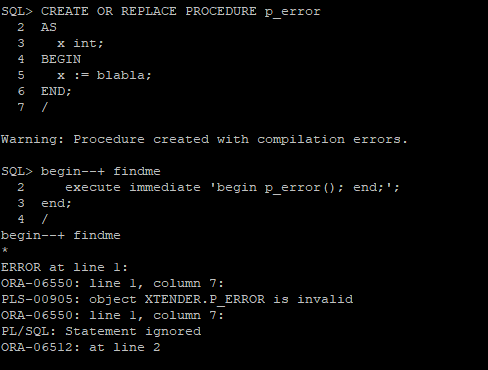 let’s generate an error
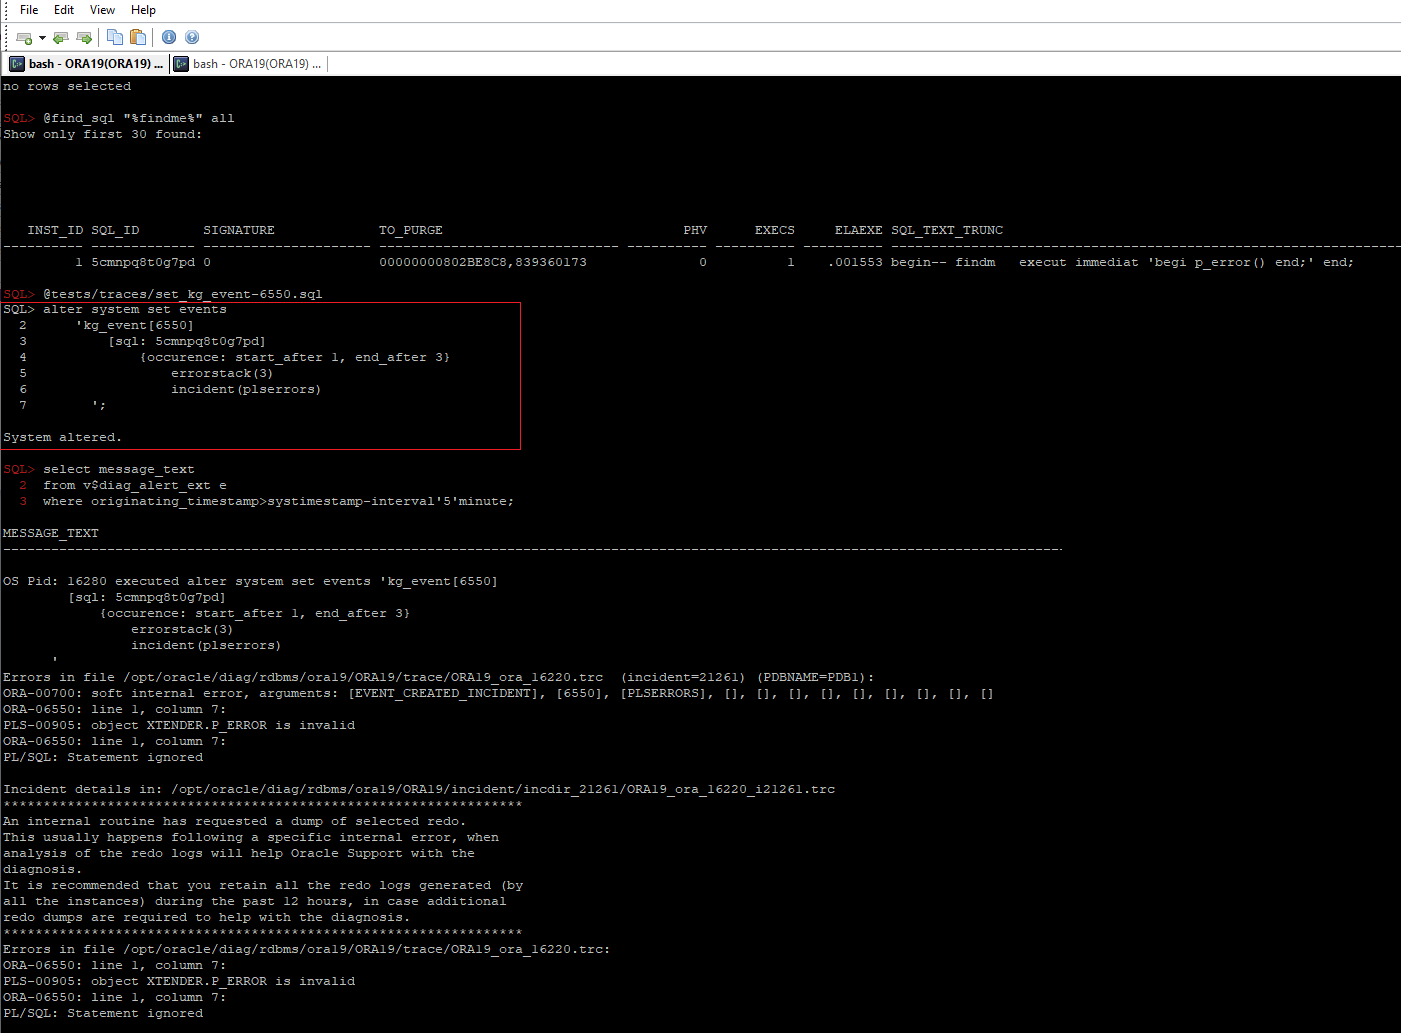 we can see that an incident file was successfully generated
PS, More details in Tanel Poder’s articles:
1. The full power of Oracle’s diagnostic events, part 1: Syntax for KSD debug event handling
2. The full power of Oracle’s diagnostic events, part 2: ORADEBUG DOC and 11g improvements
3. What Caused This Wait Event: Using Oracle’s wait_event[] tracing
4. http://tech.e2sn.com/oracle/troubleshooting/oradebug-doc
Ora C functions on Frits Hoogland’s site: http://orafun.info/
HTML version of the internal oradebug/diagnostic events doc: http://orasql.org/files/events
v$blog #funny #friday
select title, short_url
from v$blog
where pubDate>=systimestamp - interval '5' month;
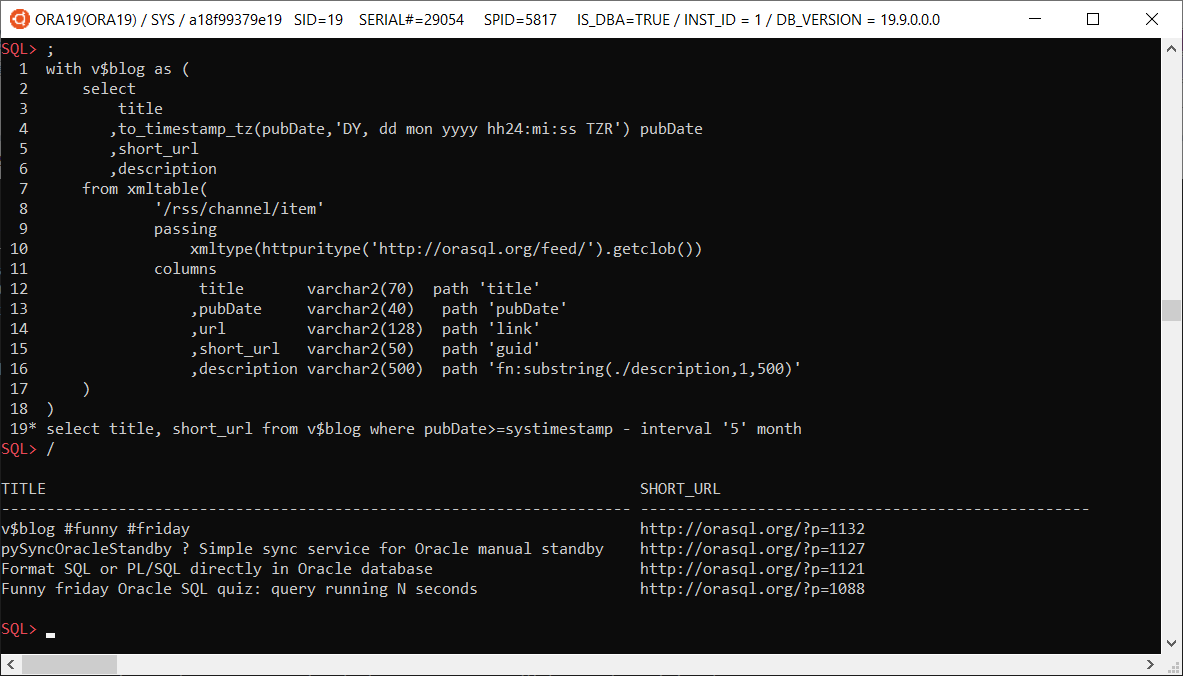
with v$blog as (
    select
        title
       ,to_timestamp_tz(pubDate,'DY, dd mon yyyy hh24:mi:ss TZR') pubDate
       ,short_url
       ,description
    from xmltable(
            '/rss/channel/item'
            passing
                xmltype(httpuritype('http://orasql.org/feed/').getclob())
            columns
                 title       varchar2(70)  path 'title'
                ,pubDate     varchar2(40)   path 'pubDate'
                ,url         varchar2(128)  path 'link'
                ,short_url   varchar2(50)   path 'guid'
                ,description varchar2(500)  path 'fn:substring(./description,1,500)'
    )
)
select title, short_url from v$blog where pubDate>=systimestamp - interval '5' month;
Triaging Smart Scan
This document is my attempt to bring together the available options that can be used to determine the root cause of an issue in order to create a roadmap to help support engineers narrow down the cause of concern.
It is a living document and will be edited and amended as time goes by. Please do check back again in the future.
Warning: these parameters should only be used in conjunction with an Oracle Support Engineer and are not intended for DBAs to self-triage; also they should not be left set after triage without discussion with an Oracle Support Engineer.
The Basics- Check if the issue reproduces without SmartScan
alter session set cell_offload_processing=FALSE;
orselect /*+ opt_param(‘cell_offload_processing’,’false') */ <col> from <tab>;
This completely turns off Smart Scan, RDBMS will act like non-Exadata and do its own disk I/O through the buffer cache or Direct Read
- Check if the issue reproduces in cell pass thru mode
alter session set “_kcfis_cell_passthru_enabled”=TRUE;
This still uses SmartScan but turns off the smarts, the blocks are read by the offload server and returned unprocessed
- Check if it reproduces in emulation mode
alter session set “_rdbms_internal_fplib_enabled”=TRUE;
alter session set “_serial_direct_read”=TRUE;
This mode runs the copy of Smart Scan linked into RDBMS to see if the issue stems from offload but not the SmartScan part of it. Be aware: bug fixes and patches are delivered to RDBMS and to the offload server independently – one may have fixes that the other does not and vice versa.
- There is NO point in trying
— alter session set “_kcfis_rdbms_blockio_enabled”=TRUE;
It simply forces the ‘file intelligent storage’ layer to divert to the ‘direct file’ layer i.e. regular block I/O – this achieves exactly the same thing as ‘cell_offload_processing=FALSE’ but in a round about way.
- Check if the issue reproduces with storage index disabled
alter session set “_kcfis_storageidx_disabled”=TRUE;
This will completely disable Storage Index and all chunks will be processed by SmartScan without SI filtering happening.
- Check if the issue reproduces in Diagnostic mode
alter session set “_ kcfis_storageidx_diag_mode “=1;
This will run the query both with and without SI and then compare to make sure SI would have returned the same result for that chunk.
- Check whether SI Min/Max processing is the issue:
alter cell offloadgroupEvents = “immediate cellsrv.cellsrv_setparam(‘_cell_pred_enable_fp_preprocess’, ‘FALSE’)”;
- Check whether any Set Memerbship metadata stored in SI is the issue (this only works in conjunction with the IM format columnar cache a.k.a CC2).
alter session set “_kcfis_storageidx_set_membership_disabled”=FALSE;
- If the object is to bypass FC for a single table, the correct way to eliminate FC as a cause is to disable caching for that segment and cause any cached blocks to be flushed.
alter table <foo> storage( cell_flash_cache NONE);
In order to resume default behaviour one would use:
alter table <foo> storage(cell_flash_cache DEFAULT );
- If the goal is to completely bypass the FC layer we need to change the caching policy of the griddisk which will flush the current contents and prevent both write-thru and write-back caching.
cellcli>ALTER GRIDDISK grid_disk_name CACHINGPOLICY=”none”;
In order to resume normal caching policy, one would use:
cellcli>ALTER GRIDDISK grid_disk_name CACHINGPOLICY=”default”;
- Note: the parameter “_kcfis_kept_in_cellfc_enabled” is NOT the correct way to bypass FC because in many cases the disk I/O must go through FC anyway.
- Check if the columnar cache is the cause of the issue:
alter session set “_enable_columnar_cache”=0;
and to turn it back on again with default behaviour:
alter session set “_enable_columnar_cache”=1;
Note: do not use “_kcfis_cellcache_disabled” – that is not the correct way to triage this.
- Check if the IM format (a.k.a. CC2) columnar cache is the cause of the issue by forcing version 1 format to be used:
alter session set “_enable_columnar_cache”=33; — 0x01 + 0x20
- Check whether using the columnar cache with row-major blocks is the cause of the issue
alter session set “_enable_columnar_cache”=16385; — 0x01 + 0x4000
- Check whether using the columnar cache with Hybrid Columnar blocks is the cause of the issue
alter session set “_enable_columnar_cache”=32769; — 0x01 + 0x8000
Please see:
- Using trace events in an offload server
- Tracing Hybrid Columnar Compression Offload
- Tracing an Offload Group
- PCODE is our new byte code for evaluating predicates and aggregates – to go back to the old way use:
alter session set “_kdz_pcode_flags” = 1;
and to turn it back on again:
alter session set “_kdz_pcode_flags” = 0;
- Disable LOB predicate pushdown to Smart Scan:
alter session set “_dbg_scan”=1;
- Disable rowset function evaluation in Smart Scan:
alter session set “_dbg_scan”=4096;
- Disable aggregation pushdown to Smart Scan:
alter session set “_dbg_scan”=8192;
- Disable Hybrid IM scan – this is where In-Memory is interleaved with Smart Scan
alter session set “_dbg_scan”=131072;
pySyncOracleStandby – Simple sync service for Oracle manual standby
I created this simple service a couple of years ago. It’s pretty simple, small and intuitive Python app, so you can easily modify it to suit your own needs and run on any platform: https://github.com/xtender/pySync
Format SQL or PL/SQL directly in Oracle database
Obviously we can format/beautify SQL or PL/SQL code using external tools, but sometimes it would be more convenient to format it directly in database, for example if we want to see few different sql_text’s from v$sqlarea. And thanks to Oracle SqlCL and Oracle SQL Developer, we can easily use oracle.dbtools.app.Format function from their Java library dbtools-common.jar, so if you use SqlCL or SQL Developer, you can use the same formatting options.
1. load appropriate java library into OracleYou may have already installed SQLDeveloper or SqlCL on your database server, just check $ORACLE_HOME/sqldeveloper or $ORACLE_HOME/sqcl directories. If – not, you need to download appropriate SqlCL version that matches your java version in Oracle. For 12.2 – 19.8 you can download latest SqlCL 20.3. In fact we need just dbtools-common.jar from lib directory. I put it into $ORACLE_HOME/sqlcl/lib directory on the server and load it using loadjava:
loadjava -u login/pass@pdb1 $ORACLE_HOME/sqlcl/lib/dbtools-common.jar
Just change your login credentials and dbname.
2. set java permissionsThen you need to grant required Java permissions:
exec dbms_java.grant_permission( '{USERNAME}', 'SYS:java.lang.RuntimePermission', 'oracle.DbmsJavaScriptUser', '' );
exec dbms_java.grant_permission( '{USERNAME}', 'SYS:java.lang.RuntimePermission', 'accessClassInPackage.jdk.nashorn.internal.runtime', '' );
exec dbms_java.grant_permission( '{USERNAME}', 'SYS:java.lang.reflect.ReflectPermission', 'suppressAccessChecks', '' );
3. create java functions
As you can see, in the code below you can specify own formatting options (function getFormat()). For example, formatting options from Trivadis: https://github.com/Trivadis/plsql-formatter-settings/blob/main/settings/sql_developer/trivadis_advanced_format.xml
You can copy the code below, but it would be better to take latest code from https://github.com/xtender/xt_scripts/tree/master/extra/SQLFormatter
CREATE or replace AND COMPILE JAVA SOURCE NAMED SQLFormatter AS
/* Imports */
import oracle.dbtools.app.Format;
import java.sql.Connection;
import java.sql.DriverManager;
import java.sql.SQLException;
import oracle.sql.BLOB;
import oracle.sql.CLOB;
import java.io.StringWriter;
import java.io.PrintWriter;


public class SQLFormatter {

    private static String getStackTrace(Exception e) {
       StringWriter writer = new StringWriter();
       PrintWriter printWriter = new PrintWriter( writer );
       e.printStackTrace( printWriter );
       printWriter.flush();

       return writer.toString();
    }

    public static Format getFormat() {
        oracle.dbtools.app.Format format = new oracle.dbtools.app.Format();

        format.options.put("singleLineComments", Format.InlineComments.CommentsUnchanged);
        format.options.put("kwCase", Format.Case.UPPER);
        format.options.put("idCase", Format.Case.NoCaseChange);                             // default: Format.Case.lower
        format.options.put("adjustCaseOnly", false);                                        // default: false (set true to skip formatting)
        format.options.put("formatThreshold", 1);                                           // default: 1 (disables deprecated post-processing logic)
        // Alignment
        format.options.put("alignTabColAliases", false);                                    // default: true
        format.options.put("alignTypeDecl", true);
        format.options.put("alignNamedArgs", true);
        format.options.put("alignEquality", false);
        format.options.put("alignAssignments", true);                                       // default: false
        format.options.put("alignRight", false);                                            // default: false
        // Indentation
        format.options.put("identSpaces", 3);                                               // default: 4
        format.options.put("useTab", false);
        // Line Breaks
        format.options.put("breaksComma", Format.Breaks.Before);                            // default: Format.Breaks.After
        format.options.put("breaksProcArgs", false);
        format.options.put("breaksConcat", Format.Breaks.Before);
        format.options.put("breaksAroundLogicalConjunctions", Format.Breaks.Before);
        format.options.put("breaksAfterSelect", true);                                      // default: true
        format.options.put("commasPerLine", 1);                                             // default: 5
        format.options.put("breakOnSubqueries", true);
        format.options.put("breakAnsiiJoin", true);                                         // default: false
        format.options.put("breakParenCondition", true);                                    // default: false
        format.options.put("maxCharLineSize", 120);                                         // default: 128
        format.options.put("forceLinebreaksBeforeComment", false);                          // default: false
        format.options.put("extraLinesAfterSignificantStatements", Format.BreaksX2.Keep);   // default: Format.BreaksX2.X2
        format.options.put("flowControl", Format.FlowControl.IndentedActions);
        // White Space
        format.options.put("spaceAroundOperators", true);
        format.options.put("spaceAfterCommas", true);
        format.options.put("spaceAroundBrackets", Format.Space.Default);
        //format.options.put("formatProgramURL", "default");

        return format;
    }

  public static String format(String str)
  {
    String res;
    try {
       //res = new Format().format(str);
       Format f = SQLFormatter.getFormat();
       res = f.format(str);
       }
    catch (Exception e){
       res = "Error: " + e.getMessage() + " [ " + SQLFormatter.getStackTrace(e) + " ]";
    }
    return res;
  }

  public static CLOB formatClob(oracle.sql.CLOB clob)
  throws SQLException
  {
    String str = clob.getSubString(1, (int) clob.length());
    String res = SQLFormatter.format(str);
    Connection conn = DriverManager.getConnection("jdbc:default:connection:");
    CLOB resClob = CLOB.createTemporary(conn, false, BLOB.DURATION_SESSION);
    resClob.setString(1L, res);

    return resClob;
  }
}
/
4. Create PL/SQL package for it
create or replace package SQLFormatter as

  FUNCTION Format(str in varchar2) RETURN VARCHAR2
  AS LANGUAGE JAVA NAME 'SQLFormatter.format(java.lang.String) return java.lang.String';

  FUNCTION FormatClob(str in clob) RETURN CLOB
  AS LANGUAGE JAVA NAME 'SQLFormatter.formatClob(oracle.sql.CLOB) return oracle.sql.CLOB';

end;
/
Now we can test it:
SQL> select SQLFormatter.format('select 1 a,2 /*123 */ b,3 c, d from dual, dual d2') qtext from dual;
QTEXT
----------------------------------------------------------------------------------------------------
SELECT
1 a
, 2 /*123 */ b
, 3 c
, d
FROM
dual
, dual d2
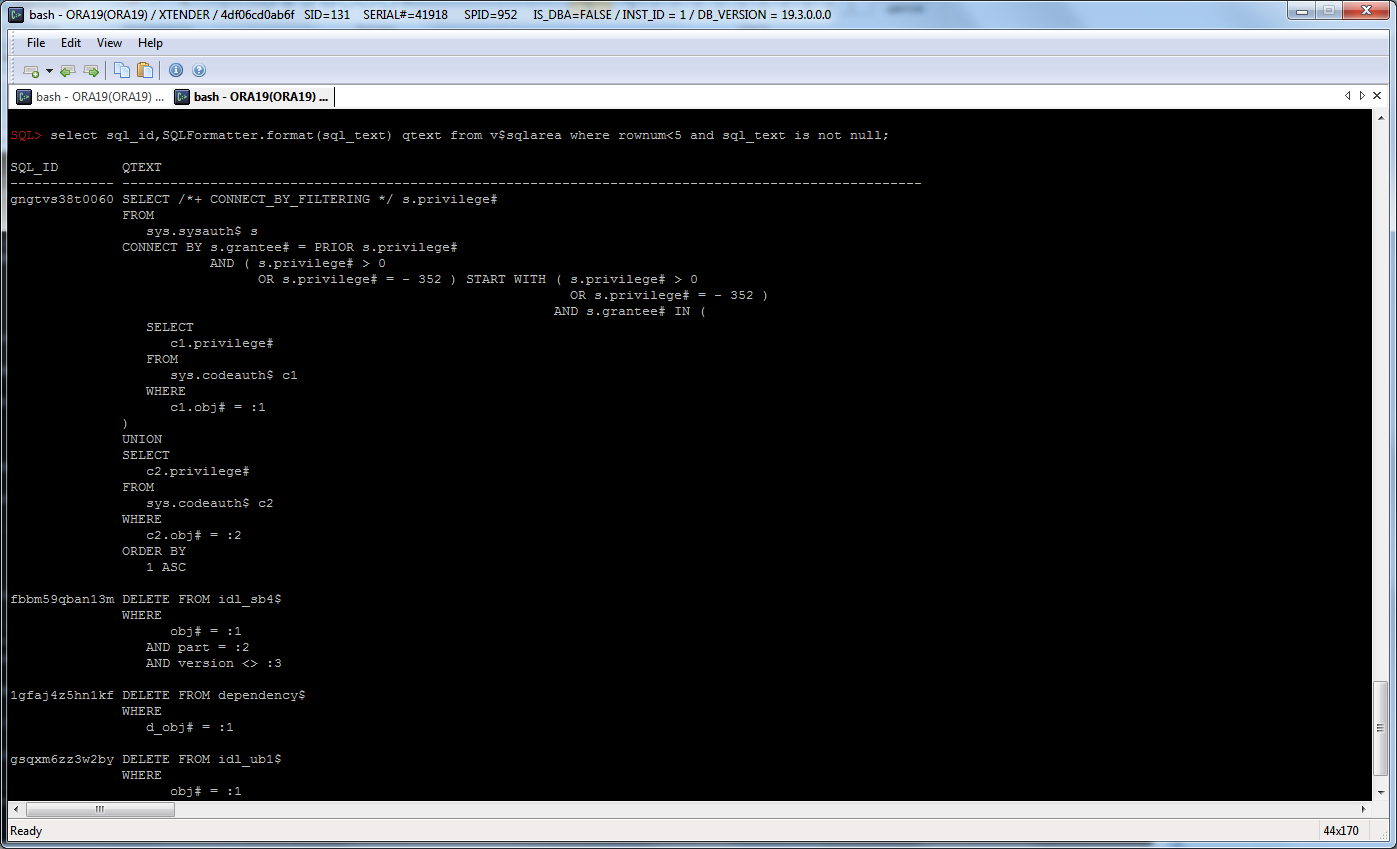
SQL> select sql_id,SQLFormatter.format(sql_text) qtext from v$sqlarea where rownum<3 and sql_text is not null;
SQL_ID QTEXT
------------- -------------------------------------
fbbm59qban13m DELETE FROM idl_sb4$
WHERE
obj# = :1
AND part = :2
AND version <> :3
1gfaj4z5hn1kf DELETE FROM dependency$
WHERE
d_obj# = :1
Funny friday Oracle SQL quiz: query running N seconds
Write a pure SQL query with PL/SQL that stop after :N seconds, where :N is a bind variable.
with v(start_hsecs, delta, flag) as (
  select
    hsecs as start_hsecs,
    0 as delta,
    1 as flag
  from v$timer
  union all
  select
    v.start_hsecs,
    (t.hsecs-v.start_hsecs)/100 as delta,
    case when (t.hsecs-v.start_hsecs)/100 > :N /* seconds */ then v.flag*-1 else v.flag+1 end as flag
  from v, v$timer t
  where v.flag>0
    and t.hsecs>=v.start_hsecs
)
select delta
from v
where flag+rownum<=0;
SQL> var N number
SQL> exec :N := 3 /* seconds */;

PL/SQL procedure successfully completed.

SQL> select...

     DELTA
----------
      3.01

1 row selected.

Elapsed: 00:00:03.01
Another my solution using sys.standard.current_timestamp, so some internal pl/sql…:
select count(*) from dual
connect by sys.standard.current_timestamp - current_timestamp <= interval'3'second;
Simple function returning Parallel slave info
You can add also any information from v$rtsm_sql_plan_monitor if needed
create or replace function px_session_info return varchar2 parallel_enable as
   vSID int;
   res varchar2(30);
begin
   vSID:=userenv('sid');
   select
           to_char(s.server_group,'fm000')
    ||'-'||to_char(s.server_set,'fm0000')
    ||'-'||to_char(s.server#,'fm0000')
    ||'('||s.sid||','||s.degree||'/'||s.req_degree||')'
    into res
   from v$px_session s
   where s.sid=vSID;
   return res;
exception when no_data_found then
   return 'no_parallel';
end;
/
Simple example:
select--+ parallel
  px_session_info, count(*)
from sys.obj$
group by px_session_info
/
PX_SESSION_INFO           COUNT(*)
------------------------  --------
001-0002-0001(630,2/2)     38298
001-0002-0002(743,2/2)     34706
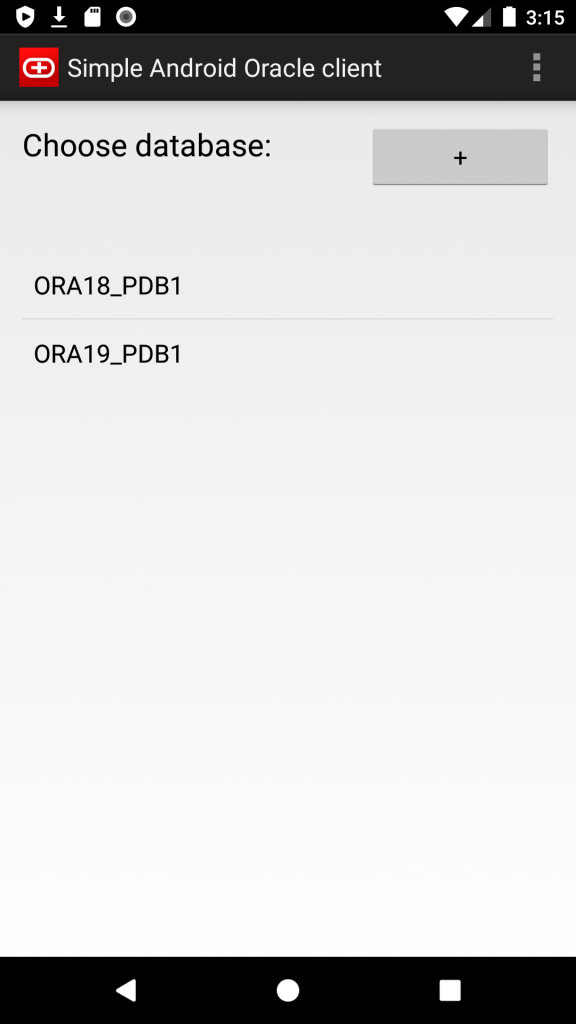
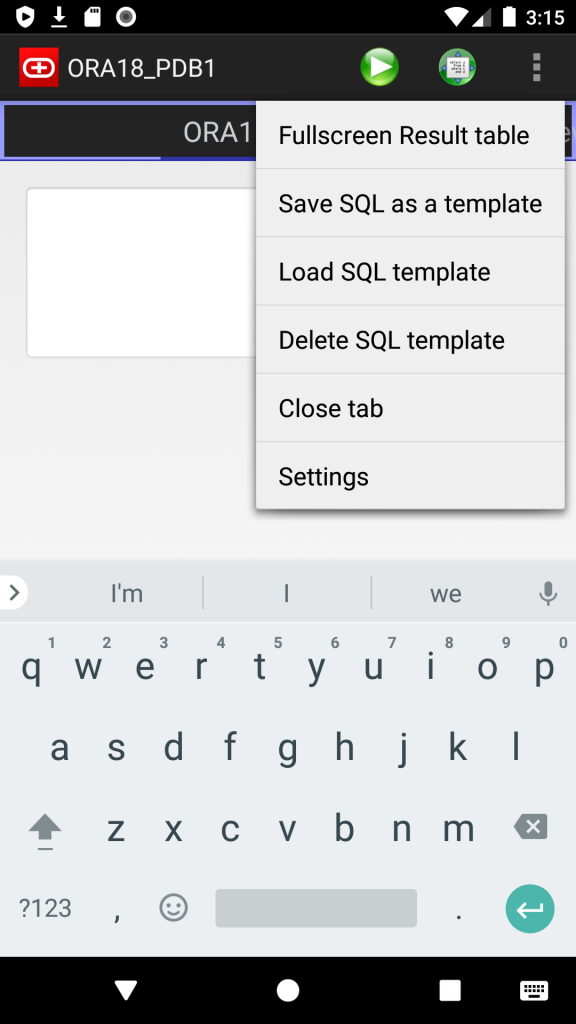
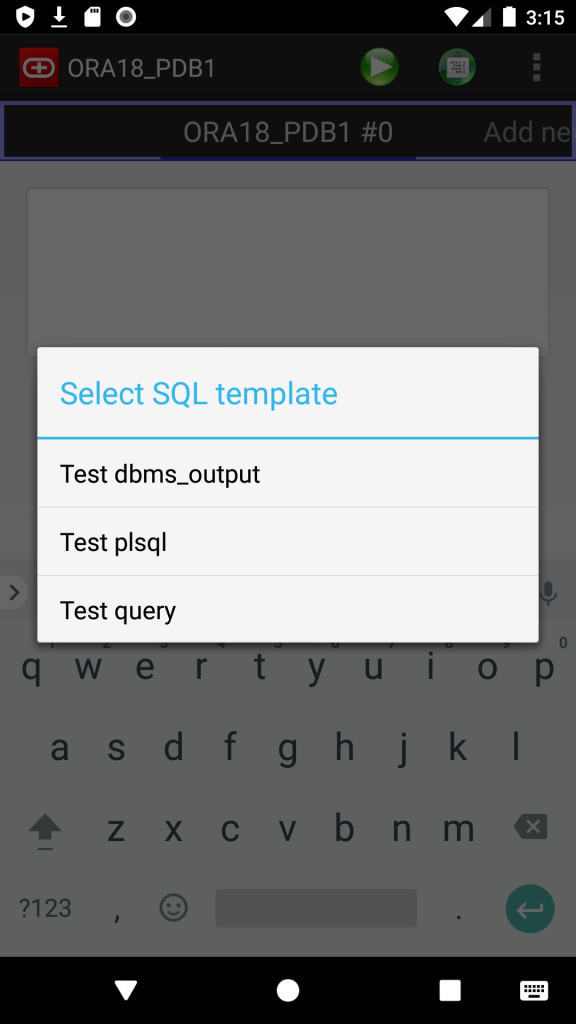
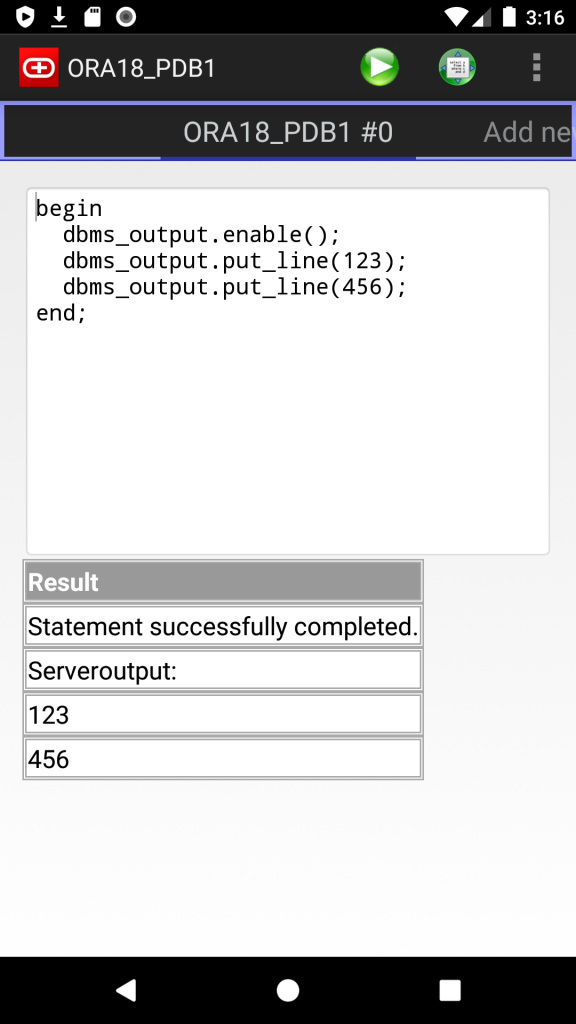
Android Oracle Client 2.0
I’ve just released new version of my Simple Android Oracle Client.
New features:
- Supported Oracle versions: 11.2, 12.1, 12.2, 18, 19, 20.
- SQL Templates: now you can save and load own script templates
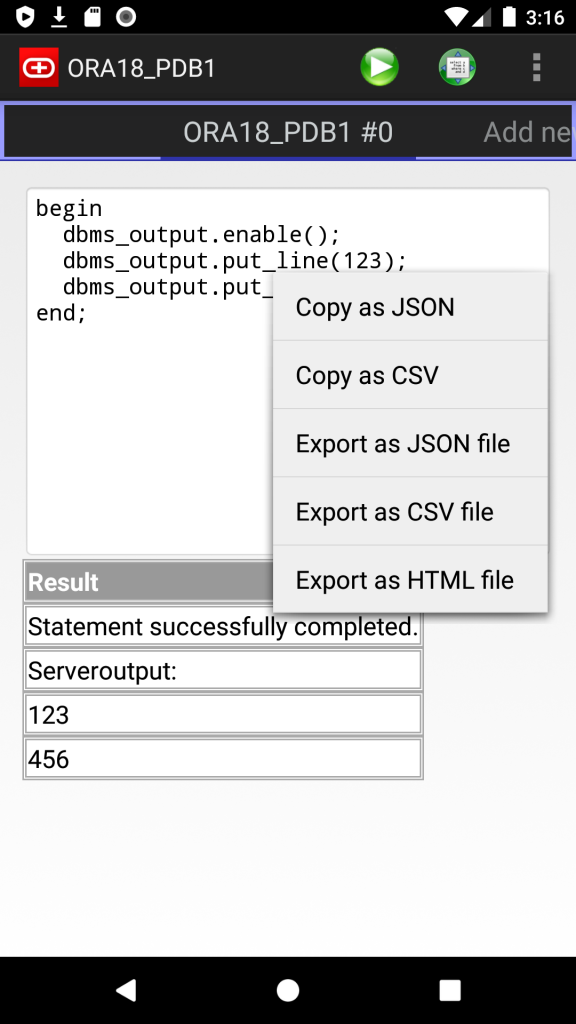
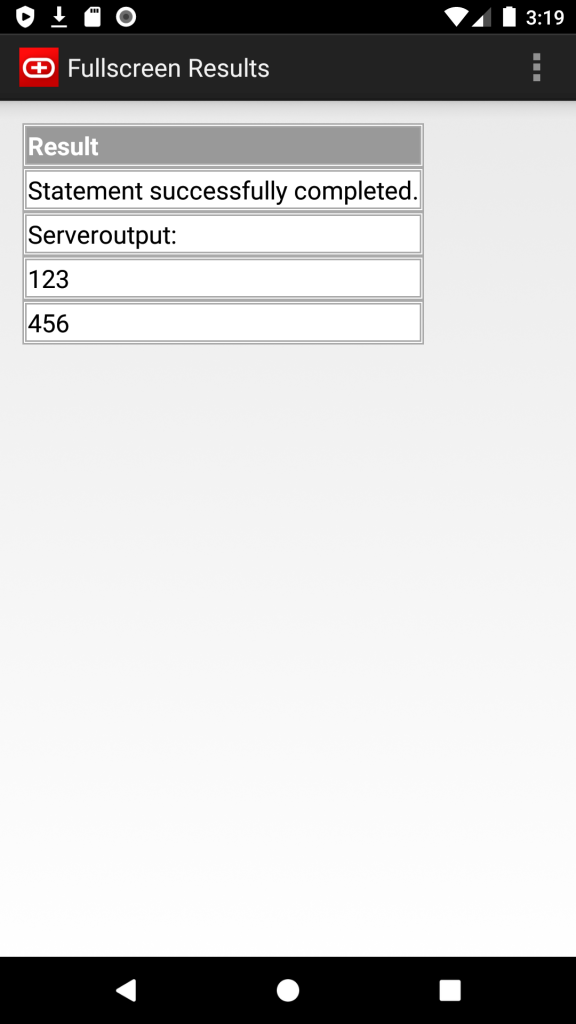
- Server output (dbms_output)
- Export results as JSON, CSV and HTML files (long tap on results)
- Copy results to the Clipboard as JSON or CSV
I use it just for basic troubleshooting and small fixes, but, please, let me know if you need anything else.
Screenshots: